25
$\begingroup$

Here is my experiment:

I am using the findPeaks function in the quantmod package:

I want to detect "local" peaks within a tolerance 5, i.e. the first locations after the time series drops from the local peaks by 5:

aa=100:1
bb=sin(aa/3)
cc=aa*bb
plot(cc, type="l")
p=findPeaks(cc, 5)
points(p, cc[p])
p

The output is

[1] 3 22 41

It seems wrong, as I am expecting more "local peaks" than 3...

Any thoughts?

$\endgroup$
3
  • $\begingroup$ I don't have this package. Can you describe the numerical routine being used? $\endgroup$
    – AdamO
    Commented Feb 16, 2012 at 17:36
  • 1
    $\begingroup$ The full source code for findPeaks appears in my reply, @Adam. BTW, the package is "quantmod". $\endgroup$
    – whuber
    Commented Feb 16, 2012 at 19:02
  • $\begingroup$ Cross posted on R-SIG-Finance. $\endgroup$ Commented Feb 17, 2012 at 13:12

8 Answers 8

10
$\begingroup$

The source of this code is obtained by typing its name at the R prompt. The output is

function (x, thresh = 0) 
{
    pks <- which(diff(sign(diff(x, na.pad = FALSE)), na.pad = FALSE) < 0) + 2
    if (!missing(thresh)) {
        pks[x[pks - 1] - x[pks] > thresh]
    }
    else pks
}

The test x[pks - 1] - x[pks] > thresh compares each peak value to the value immediately succeeding it in the series (not to the next trough in the series). It uses a (crude) estimate of the size of the slope of the function immediately after the peak and selects only those peaks where that slope exceeds thresh in size. In your case, only the first three peaks are sufficiently sharp to pass the test. You will detect all the peaks by using the default:

> findPeaks(cc)
[1]  3 22 41 59 78 96
$\endgroup$
37
$\begingroup$

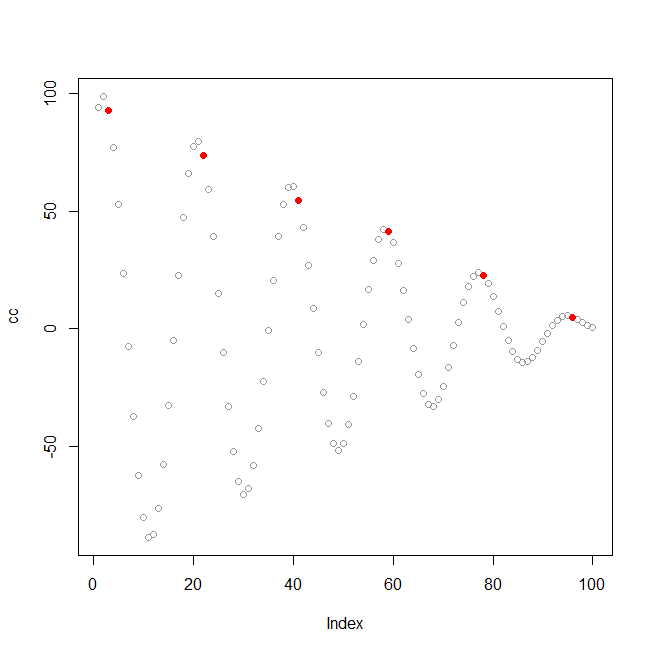
I agree with whuber's response but just wanted to add that the "+2" portion of the code, which attempts to shift the index to match the newly found peak actually 'overshoots' and should be "+1". for instance in the example at hand we obtain:

> findPeaks(cc)
[1]  3 22 41 59 78 96

when we highlight these found peaks on a graph (bold red): enter image description here

we see that they are consistently 1 point away from the actual peak.

consequenty

pks[x[pks - 1] - x[pks] > thresh]

should be pks[x[pks] - x[pks + 1] > thresh] or pks[x[pks] - x[pks - 1] > thresh]

BIG UPDATE

following my own quest to find an adequate peak finding function i wrote this:

find_peaks <- function (x, m = 3){
    shape <- diff(sign(diff(x, na.pad = FALSE)))
    pks <- sapply(which(shape < 0), FUN = function(i){
       z <- i - m + 1
       z <- ifelse(z > 0, z, 1)
       w <- i + m + 1
       w <- ifelse(w < length(x), w, length(x))
       if(all(x[c(z : i, (i + 2) : w)] <= x[i + 1])) return(i + 1) else return(numeric(0))
    })
     pks <- unlist(pks)
     pks
}

a 'peak' is defined as a local maxima with m points either side of it being smaller than it. hence, the bigger the parameter m, the more stringent is the peak funding procedure. so:

find_peaks(cc, m = 1)
[1]  2 21 40 58 77 95

the function can also be used to find local minima of any sequential vector x via find_peaks(-x).

Note: i have now put the function on gitHub if anyone needs it: https://github.com/stas-g/findPeaks

$\endgroup$
2
  • $\begingroup$ Is it possible to do this by grouped variables within 1 dataframe? $\endgroup$ Commented Oct 4, 2023 at 19:27
  • $\begingroup$ I'm trying to do: output <- df %>% group_by(variable) %>% mutate(peaks = find_peaks(datacolumn, m = 1)) $\endgroup$ Commented Oct 4, 2023 at 20:24
8
$\begingroup$

Eek: Minor update. I had to change two lines of code, the bounds, (add a -1 and +1) to reach equivalency with Stas_G's function(it was finding a few too many 'extra peaks' in real data-sets). Apologies for anyone lead very minorly astray by my original post.

I have been using Stas_g's find peaks algorithm for quite some time now. It was beneficial to me for one of my later projects due to its simplicity. I however, needed to use it millions of times for a computation so I rewrote it in Rcpp(See Rcpp package). It is roughly 6x faster then the R version in simple tests. If anyone is interested I have added the code below. Hopefully I help someone, Cheers!

Some minor caveats. This function returns peak indices in reverse order of the R code. It requires a inhouse C++ Sign function, which I included. It has not been completely optimized but any further performance gains aren't expected.

//This function returns the sign of a given real valued double.
// [[Rcpp::export]]
double signDblCPP (double x){
  double ret = 0;
  if(x > 0){ret = 1;}
  if(x < 0){ret = -1;}
  return(ret);
}

//Tested to be 6x faster(37 us vs 207 us). This operation is done from 200x per layer
//Original R function by Stas_G
// [[Rcpp::export]]
NumericVector findPeaksCPP( NumericVector vY, int m = 3) {
  int sze = vY.size();
  int i = 0;//generic iterator
  int q = 0;//second generic iterator

  int lb = 0;//left bound
  int rb = 0;//right bound

  bool isGreatest = true;//flag to state whether current index is greatest known value

  NumericVector ret(1);
  int pksFound = 0;

  for(i = 0; i < (sze-2); ++i){
    //Find all regions with negative laplacian between neighbors
    //following expression is identical to diff(sign(diff(xV, na.pad = FALSE)))
    if(signDblCPP( vY(i + 2)  - vY( i + 1 ) ) - signDblCPP( vY( i + 1 )  - vY( i ) ) < 0){
      //Now assess all regions with negative laplacian between neighbors...
      lb = i - m - 1;// define left bound of vector
      if(lb < 0){lb = 0;}//ensure our neighbor comparison is bounded by vector length
      rb = i + m + 1;// define right bound of vector
      if(rb >= (sze-2)){rb = (sze-3);}//ensure our neighbor comparison is bounded by vector length
      //Scan through loop and ensure that the neighbors are smaller in magnitude
      for(q = lb; q < rb; ++q){
        if(vY(q) > vY(i+1)){ isGreatest = false; }
      }

      //We have found a peak by our criterion
      if(isGreatest){
        if(pksFound > 0){//Check vector size.
         ret.insert( 0, double(i + 2) );
       }else{
         ret(0) = double(i + 2);
        }
        pksFound = pksFound + 1;
      }else{ // we did not find a peak, reset location is peak max flag.
        isGreatest = true;
      }//End if found peak
    }//End if laplace condition
  }//End loop
  return(ret);
}//End Fn
$\endgroup$
3
  • $\begingroup$ This for loop seems flawed, @caseyk: for(q = lb; q < rb; ++q){ if(vY(q) > vY(i+1)){ isGreatest = false; } } as the last run through the loop "wins", doing the equivalent of: isGreatest = vY(rb-1) <= vY(rb). To achieve what the comment just above that line claims, the for loop would need to be changed to: for(q = lb; isGreatest && (q < rb); ++q){ isGreatest = (vY(q) <= vY(i+1)) } $\endgroup$ Commented Aug 19, 2018 at 10:13
  • $\begingroup$ Hmmm. It's been a real long time since I wrote this code. IIRC it was tested directly with Stas_G's function and maintained the exact same results. Although I do see what you are saying, I'm not sure what difference in the output that would do. It would be worthy of a post for you to investigate your solution vs the one I proposed/adapted. $\endgroup$
    – caseyk
    Commented Aug 22, 2018 at 11:02
  • $\begingroup$ I should also add that I personally tested this script probably on the order of 100x (assuming this is the one in my project) and it was used well over a million times and offered an indirect result that was in complete agreement with a literature result for a specific test case. So, if it is 'flawed' it isn't that 'flawed' ;) $\endgroup$
    – caseyk
    Commented Aug 22, 2018 at 11:12
1
$\begingroup$

Firstly: The algorithm also falsely calls a drop to the right of a flat plateau since sign(diff(x, na.pad = FALSE)) will be 0 then -1 so that its diff will also be -1. A simple fix is to ensure that the sign-diff preceding the negative entry is not zero but positive:

    n <- length(x)
    dx.1 <- sign(diff(x, na.pad = FALSE))
    pks <- which(diff(dx.1, na.pad = FALSE) < 0 & dx.1[-(n-1)] > 0) + 1

Second: The algorithm gives very local results, e.g. an 'up' followed by a 'down' in any run of three consecutive terms in the sequence. If one is interested instead in local maxima of a noised continuous function, then -- there are probably other better things out there, but this is my cheap and immediate solution

  1. identify the peaks first using running average of 3 consecutive points to
    smooth the data ever so slightly. Also employ the above mentioned control against flat then drop-off.
  2. filter these candidates by comparing, for a loess-smoothed version, the average inside a window centered at each peak with the average of local terms outside.

    "myfindPeaks" <- 
    function (x, thresh=0.05, span=0.25, lspan=0.05, noisey=TRUE)
    {
      n <- length(x)
      y <- x
      mu.y.loc <- y
      if(noisey)
      {
        mu.y.loc <- (x[1:(n-2)] + x[2:(n-1)] + x[3:n])/3
        mu.y.loc <- c(mu.y.loc[1], mu.y.loc, mu.y.loc[n-2])
      }
      y.loess <- loess(x~I(1:n), span=span)
      y <- y.loess[[2]]
      sig.y <- var(y.loess$resid, na.rm=TRUE)^0.5
      DX.1 <- sign(diff(mu.y.loc, na.pad = FALSE))
      pks <- which(diff(DX.1, na.pad = FALSE) < 0 & DX.1[-(n-1)] > 0) + 1
      out <- pks
      if(noisey)
      {
        n.w <- floor(lspan*n/2)
        out <- NULL
        for(pk in pks)
        {
          inner <- (pk-n.w):(pk+n.w)
          outer <- c((pk-2*n.w):(pk-n.w),(pk+2*n.w):(pk+n.w))
          mu.y.outer <- mean(y[outer])
          if(!is.na(mu.y.outer)) 
            if (mean(y[inner])-mu.y.outer > thresh*sig.y) out <- c(out, pk)
        }
      }
      out
    }
    
$\endgroup$
0
$\begingroup$

It's true the function also identifies the end of plateaux, but I think there is another easier fix: Since the first diff of a real peak will result in '1' then '-1', the second diff would be '-2', and we can check directly

    pks <- which(diff(sign(diff(x, na.pad = FALSE)), na.pad = FALSE) < 1) + 1
$\endgroup$
1
  • $\begingroup$ This doesn't seem to answer the question. $\endgroup$ Commented May 10, 2017 at 19:05
0
$\begingroup$

using Numpy

ser = np.random.randint(-40, 40, 100) # 100 points
peak = np.where(np.diff(ser) < 0)[0]

or

double_difference = np.diff(np.sign(np.diff(ser)))
peak = np.where(double_difference == -2)[0]

using Pandas

ser = pd.Series(np.random.randint(2, 5, 100))
peak_df = ser[(ser.shift(1) < ser) & (ser.shift(-1) < ser)]
peak = peak_df.index
$\endgroup$
0
$\begingroup$

I have not enough reputation to comment direcly on stas-g's answer but this is a comment on an issue i found with stas-g's code

I have vectors with incomplete data

a = c(1.60676107, -1.84154137, -0.03814237, -3.01587711, 6.67004912, NA, NA, -0.94917515)
# Looking at the data find_peaks(a, m=3) should return 5
# and find_peaks(-a, m= 3) should return 4
find_peaks(a, m = 3)
# returns numeric(0) with the code as is
find_peaks(-a, m)
# returns an error

The error is due to the evaluation of the all condition

if(all(x[c(z : i, (i + 2) : w)] <= x[i + 1])) return(i + 1) else return(numeric(0))

In the first case the term to evaluate by all() returns FALSE before reaching NA

and find_peaks(-a) fails because the all() returns NA and if(NA) fails.

However adding na.rm = T to all()

if(all(x[c(z : i, (i + 2) : w)] <= x[i + 1], na.rm = T)) return(i + 1) else return(numeric(0))

does not solve the issue. find_peaks(-a,m=3) returns 4 but find_peaks(a, m = 3) returns numeric(0) again instead of 5

Padding NA with the last valid value before NA will add a local extremum to the results and find_peaks(a, m= 3) returns 5 and 7

The c++ function by caseyk does return 4 and 5 as we would expect from visual observation

$\endgroup$
0
$\begingroup$

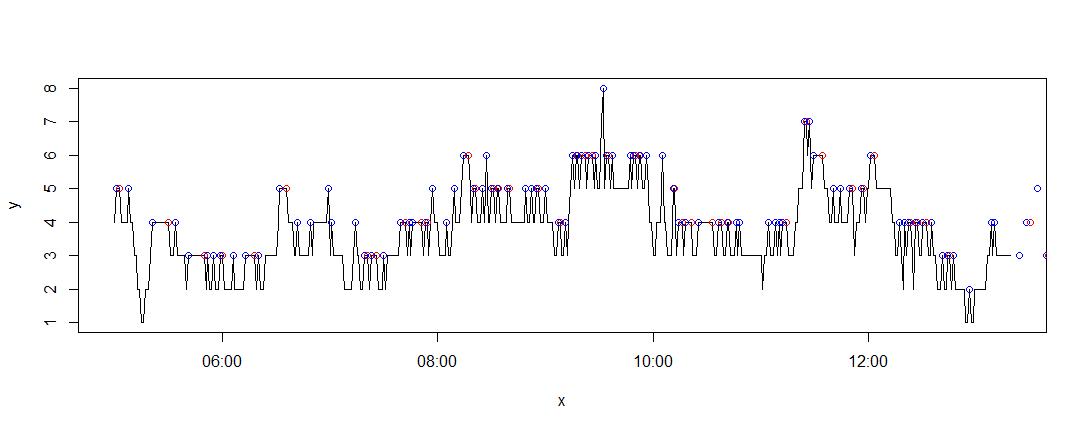
I work with long records of integer wind speeds including NAs. The integer values can have flat plateaus which count as peaks and ledges which don't count. My solution takes only 4.3 seconds to process a 11.5 million element vector on my PC:

indx.localpeaks<-function(x)  
{dw1<-sign(diff(x)) # -1=down, 0=flat, 1=up 
 names(dw1)<-c(1:length(dw1)) # tag names with original index
 i<-which(dw1==0)  # are there flats?   
 if (length(i)>0) dw1<-dw1[-i]  # close up flats 
 dw2<-diff(dw1) # second diff, peaks are -2
 indx<-as.numeric(names(which(dw2== -2))) # original index of peaks
 return(indx)
}

So

i<-indx.localpeaks(x)

indexes sharp peaks and the back end of any plateau, but the front ends can be obtained by reversing the vector x and the resulting index

j<-length(x)+1-rev(indx.localpeaks(rev(x)))

To find troughs, negate the x vector

k<-indx.localpeaks(-x)

In the example below back ends of plateaus are shown by red circles and front ends by blue circles. Local peaks in integer wind speeds

$\endgroup$

Your Answer

By clicking “Post Your Answer”, you agree to our terms of service and acknowledge you have read our privacy policy.

Not the answer you're looking for? Browse other questions tagged or ask your own question.