-1
$\begingroup$

I am using random Forest in R and only want to Plot the OOB Error.

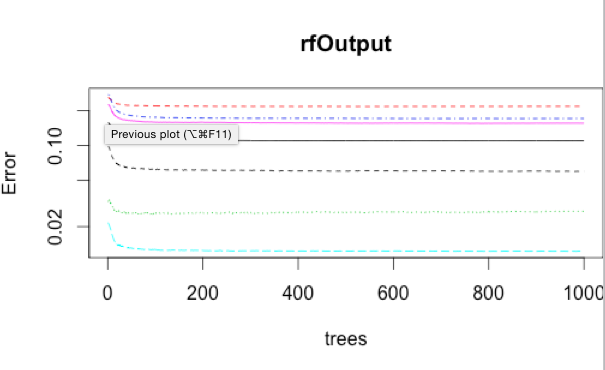
When I do plot(myModel, log = "y") I get a diagram where each of my class is a line. On the x-axis are the ntree while on the x-Axis there is the Error rate.

enter image description here

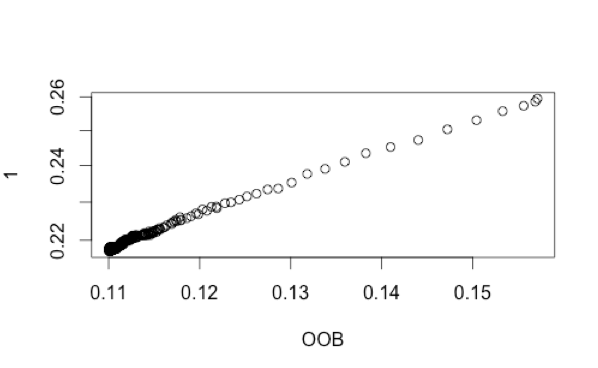
When I try plot(myModel$err.rate, log = "y") I get this:

enter image description here

Why is there no line like the ones above?

$\endgroup$

1 Answer 1

0
$\begingroup$

The err.rate is stored in a matrix where the first column is the OOB Error. Each class gets its own column.

To access the err.rate do this myModel $err.rate[,1], for plotting simply plot(myModel $err.rate[,1]).

$\endgroup$

Your Answer

By clicking “Post Your Answer”, you agree to our terms of service and acknowledge you have read our privacy policy.

Not the answer you're looking for? Browse other questions tagged or ask your own question.