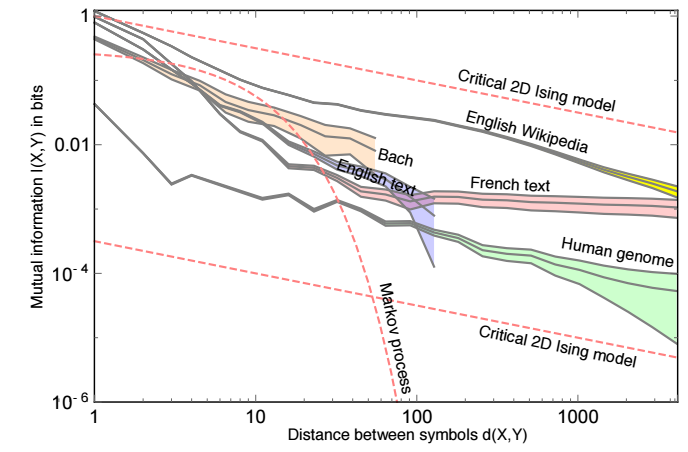
I'm having trouble reproducing this figure measuring mutual information as a function of the distance between symbols in text/music/genome/etc:
 from https://arxiv.org/pdf/1606.06737v2.pdf
Specifically, I'm trying to reproduce the Markov process red line by generating a Markov sequence, then calculating mutual information as a function of distance.
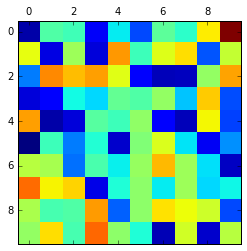
If I take some transition matrix:

And generate a sequence (e.g. array([8, 7, 7, 9, 0, 4, 2, ...)
How do I create my two distributions? For example:
dist_a = sequence[distance:]
dist_b = sequence[:-distance]
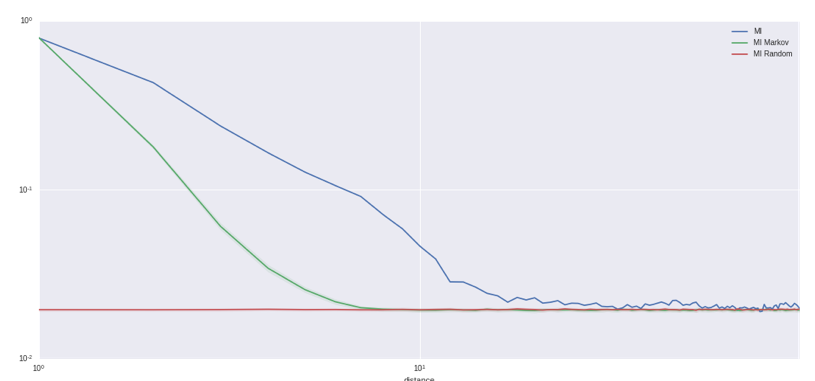
By making distributions this way, on the Shakespeare plays dataset I get a graph that looks like this:

where MI Markov is generated from a Markov process, and MI random is the a random permutation of the original texts (all at the level of characters). This clearly does not fit with the above graph, so I assume there is another way of sampling these two distributions? MI here is calculated using sklearn.metrics
