1
$\begingroup$

I'm trying to curve fit a functional form to observed data - where my observed data is a physical observation that represents a CDF.

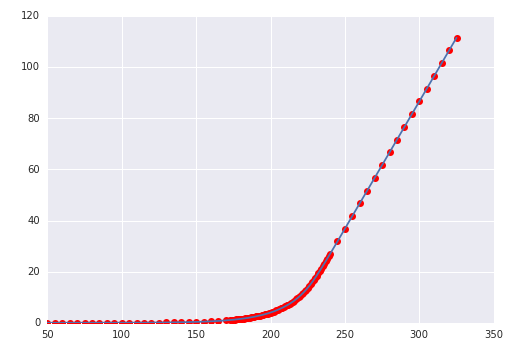
Visually - my data points currently look like this:

y_spl_2d = y_spl.derivative(n=1)
plt.plot(x_range,y_spl_2d(x_range), 'ro')

enter image description here

My goal is to get an accurate representation of the PDF. Just a visual inspection of the CDF looks good (I know... not that that means much).

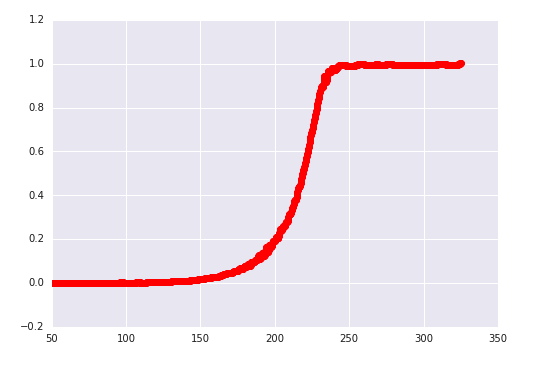
If I take the second derivative of this function numerically there is TONS of noise introduced. This is what it looks like:

enter image description here

This is where I'm at. Can I fit a functional form to this CDF data so I can take a derivative symbolically?

What is the best way - in a statistical sense - to not lose information like bi-modal PDFs and other things like this. How can I include enough parameters in my functional form to include skewness, kurtosis, etc (to not force a perfectly Gaussian distribution)?

The original fit where all of this data derives from is the derivative of an options price to the strike.

enter image description here

$\endgroup$
14
  • 2
    $\begingroup$ (1) Could you explain the relevance of the second derivative of the CDF to your question? (2) Derivatives (of any order) are unstable. You need to smooth the CDF first. It would help to know whether you expect the CDF to have a particular kind of formula and what that formula might be. It is not essential that the formula be perfectly correct--but it can provide valuable guidance concerning how to choose a good smoothing technique. $\endgroup$
    – whuber
    Commented Oct 26, 2016 at 19:37
  • $\begingroup$ Try fitting a sigmoid function. You can use your favorite fitting algorithm to do so. Looks like you did this in python. Check Scipy's documentation for fitting procedures. $\endgroup$ Commented Oct 26, 2016 at 19:38
  • $\begingroup$ @Demetri If by "sigmoid" you mean something like a logistic or tanh function, then that clearly won't work: this CDF is highly skewed. $\endgroup$
    – whuber
    Commented Oct 26, 2016 at 19:39
  • $\begingroup$ @whuber Might be worth a shot to see how bad it can be. I can't think of any other closed for functions with that behavior. Other than that, maybe use a non-parametric method and then approximate the derivatives with finite differences? $\endgroup$ Commented Oct 26, 2016 at 19:41
  • 1
    $\begingroup$ Why is this "cdf" clearly not monotonic non-decreasing? Can you explain what calculation leads to such an outcome? $\endgroup$
    – Glen_b
    Commented Oct 26, 2016 at 20:37

1 Answer 1

1
$\begingroup$

Density estimation is hard.

With the CDF, we can always use the Empirical Distribution Function (EDF) to get a consistent estimate of the CDF under mild assumptions (random independent draws from target distribution).

This is definitively not the case for density estimation. There is no way to get good estimates of the PDF without either enforcing smoothness (kernel density estimation or log-splines, for example) or other assumptions (belongs to parametric family, is log-concave, etc). This is because without any smoothness assumptions/priors, the distribution that would make the data we have seen most likely would be the distribution that puts probability $1/n$ on each of the data points we observed. Since we observed a finite data set, this is necessarily a discrete random variable, for which the PDF is undefined (i.e., it is defined by a probability mass function, not probability density function).

So let's dive into smoothness and assumptions. Parametric assumptions will generally have the best operating characteristics (i.e. lowest MSE) when the assumptions hold true, but can be heavily biased when this is false. As such, these methods are usually discarded for density estimation; choosing the wrong parametric family will have serious consequences (unlike, say linear regression, in which case OLS is known to still be a reasonable choice even if the data is not normal), and we typically have no good reason to believe that we know exactly what family the distribution belongs to.

If we decide to reject parametric assumptions, we can move to non-parametric models. Three of the most popular methods are kernel density estimation, Gaussian mixture models and log-splines. I do believe kernel density estimation is probably considered most popular, although that may differ by application. In all of these, we will need to select some sort smoothing parameter (bandwidth for kernel density estimation, number of components for GMM and number of knots for log-splines). Selection of smoothing parameter is crucial, yet non-trivial. There are automatic methods for selection (e.g., AIC), but be warned that these methods can still lead to some unsatisfying results.

In my experience, I've found kernel density estimation to be most reliable. In fact, R's density function uses this and the default settings tend to be quite reasonable. But be warned that you don't have to look too hard to find cases where the results may be unsatisfactory.

$\endgroup$

Your Answer

By clicking “Post Your Answer”, you agree to our terms of service and acknowledge you have read our privacy policy.

Not the answer you're looking for? Browse other questions tagged or ask your own question.