I think I can explain this best with an example.
I have a data set of strings such as: ATGGTCCCGTAATGCTGTGCCGA
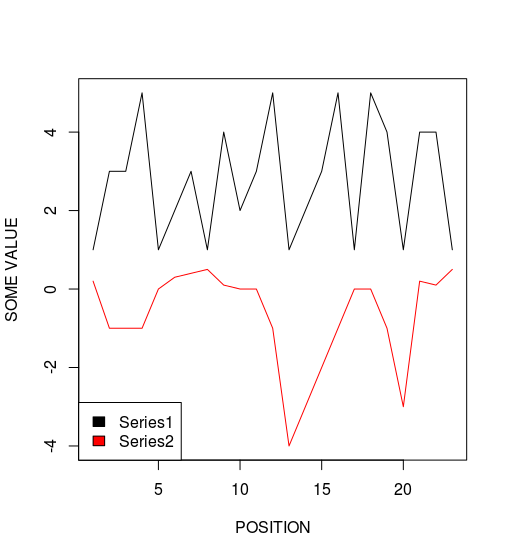
And I have multiple "series data" for each of these strings, where a value is given for each character in the string, such as:
Series data1: 1, 3, 3, 5, 1, 2, 3, 1, 4, 2, 3, 5, 1, 2, 3, 5, 1, 5, 4, 1, 4, 4, 1
Series data2: 0.2, -1, -1, -1, 0, 0.3, 0.4, 0.5, 0.1, 0, 0, -1,-4, -3, -2, -1, 0, 0, -1, -3, 0.2, 0.1, 0.5
(I currently only have two series but I will probably add 2 or 3 more "series data"s in a later stage which I would like to compare.)
Which looks like this when plotted (POSITION means position in the string):

My question is: What methods are there of analyzing/transforming the series data, so that I can append that information as a feature of the string, in such a way that a machine learner can recognize patterns within and between the "series data"?
Of course I can make a data set that looks like this:
string  |   Series 1        |   Series 2
ATGGT.. |   1, 3, 3, 5, ..  |   0.2, -1, -1, -1, ...
TTGTA.. |   1, 2, 5, 2, ..  |   0, 0.3, 0.5 , 0.1, ...
etc..
But I doubt a machine learner will be able to make sense of this.
I'm currently thinking of counting peaks/valleys in the data using certain thresholds and perhaps counting correlating peaks/valleys between series (also using some kind of threshold), for example
string  |   Series1_peaks   |   Series2_peaks   |   Series1_2_peaks
ATGGT.. |   7               |   4               |   2
TTGTA.. |   3               |   2               |   0
etc..
I think a typical machine learner would be able to make much more use of this.
However, I'm wondering if there are different approaches to this problem that I hadn't thought about yet. Perhaps specific algorithms already exists to analyze such series data?
Some details on the data: The strings are actually small DNA sequences. The length can differ greatly, ranging from a few hundred to a few thousand characters.
Note: I added the time-series tag because I thought certain algorithms used in that field might be applicable here. I don't have experience with time-series analysis though.
