English is not my first language so i apoligize for any mistakes.
I have been given a dataset containing around 700 observations of the amount of a certain chemical in the air. The observations are measured once every hour, so for each day, i have 24 observations.
I am now tasked with identifying a ARIMA model for the data.
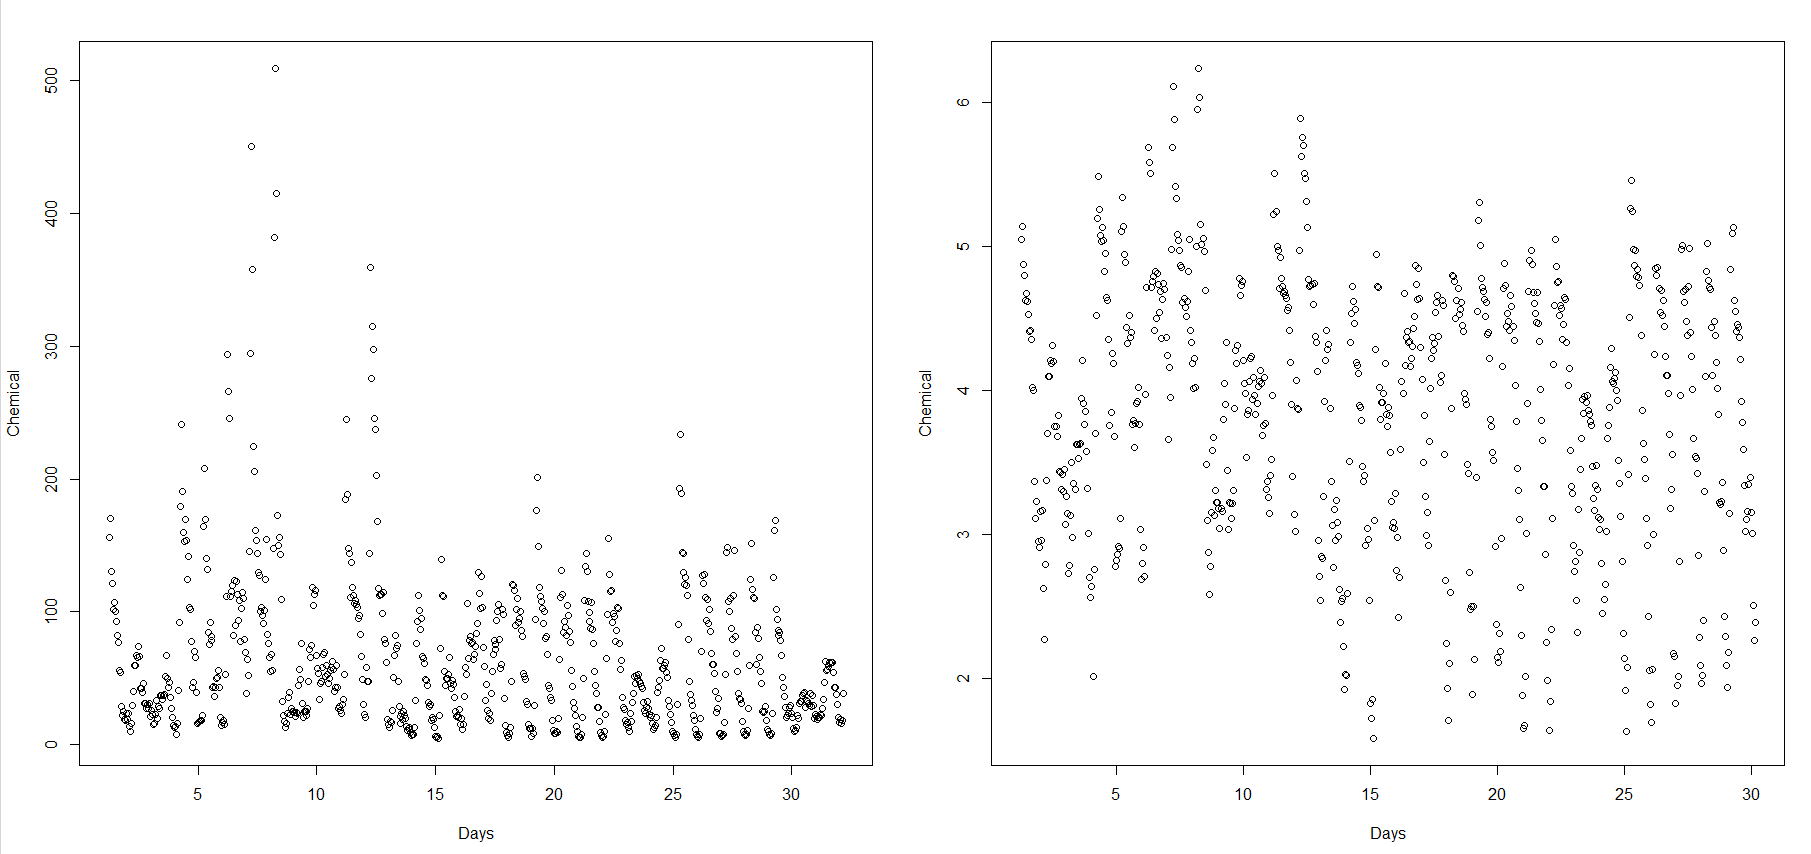
A plot of the data aswell as the log transformed data can be seen here:

It is easy to see that this must be a 24 hour seasonal model, which is also given as a hint in the assignment. It was also given as a hint that i should log transform the data, which i have done.
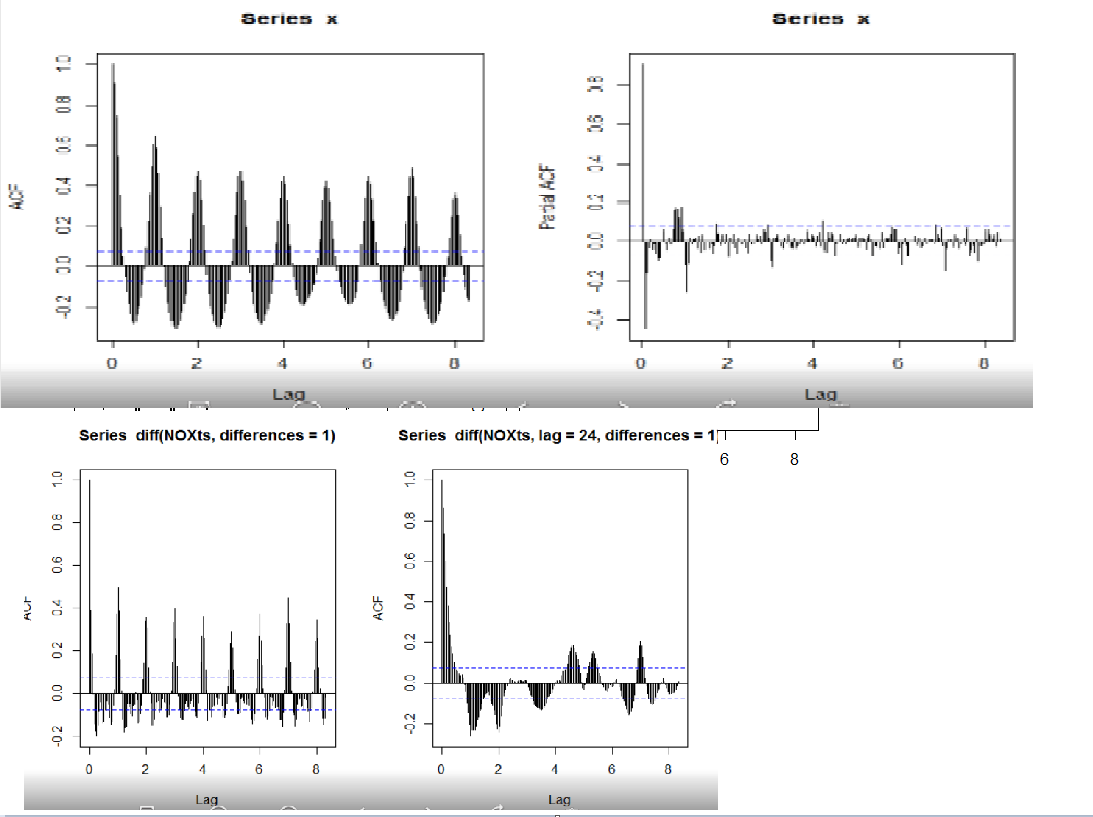
I converted the data to a time series in R using ts with frequency 24, and modelled the ACF and PACF. It is here even easier to see that the data is seasonal. I also modelled the ACF for normal differencing and seasonal differencing using lag=24 with R's diff function.

From this point on i am not sure what to do.
I am not sure how much lag i am supposed to model. Is there a good rule of thumb for how much lag compared to observations?
Normally we would use differencing if the ACF doesnt go "fast enough" towards zero(or atleast within the confidence interval).
Am i here supposed to use normal differencing or seasonal differencing. I have done both as can be seen above, with left being normal differencing, and the right being seasonal differencing with lag=24. As you can see none of them goes towards zero within 200 lag, and the same occours for second order differencing. What am i missing here?
I hope someone can point me in the right direction, since i have been unable to continue myself.
