2
$\begingroup$

I am currently doing a project which involves pothole detection and neural networks. So far, I have an Android phone that reads Accelerometer readings and writes the X,Y,Z Axis aswell as the Amplitude and current timestamp into a CSV file. The data is then normalized using min-max normalization and uses the Y axis readings from the CSV file. The problem I am facing for the neural network to learn a pothole is the fact that what data should I feed to the Back Propagation Neural Network? Shall I set a threshold and when the Y axis reaches this point, get the 5 previous points and 5 points after and then feed the network with 11 inputs? I don't want to overtrain the network nor feed it with data in different positions each time.

Training - I am also starting to gather the data collected and create a training dataset - should I put things such as readings for normal/bumpy roads/speed bumps as well as potholes? How large should a training set be? or is 'the more data the better it is' actually true?

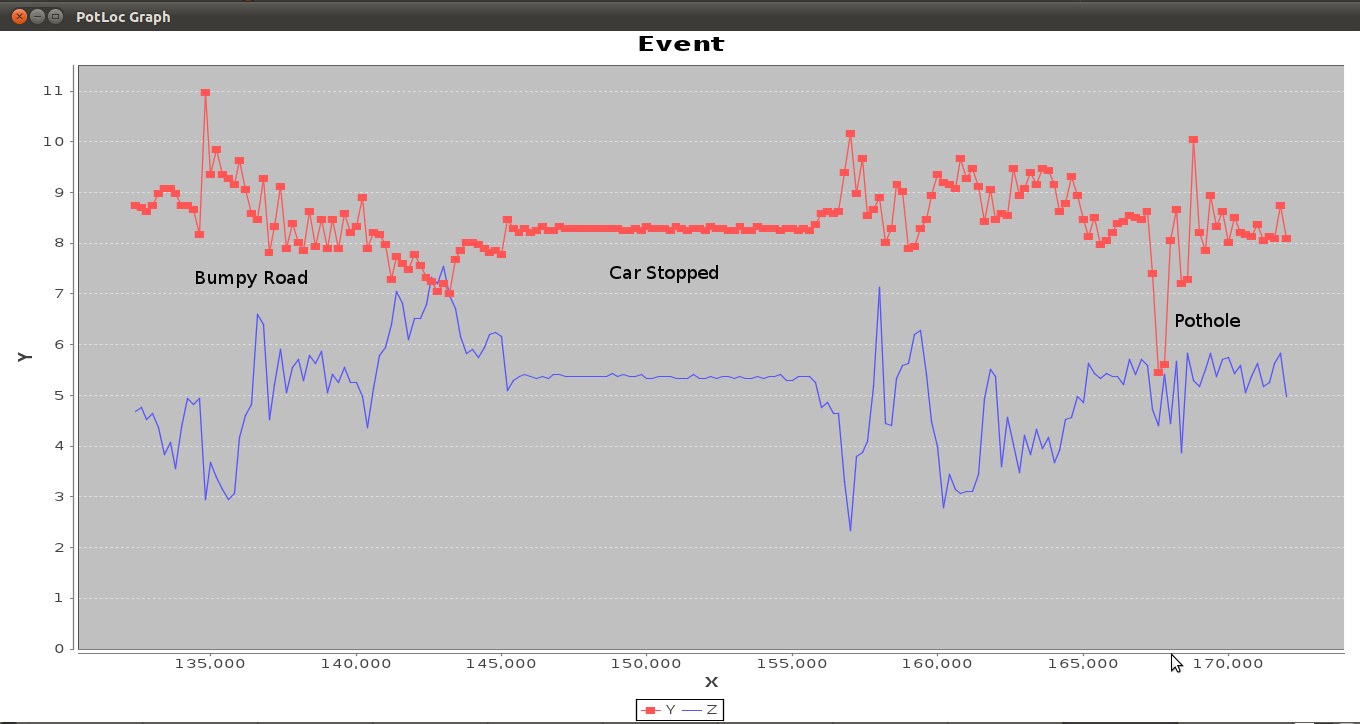
This is what the pothole data looks like.
https://i.sstatic.net/4cSzt.png

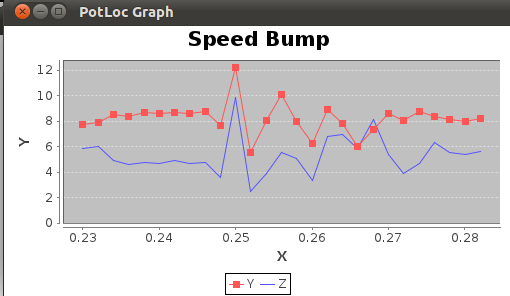
This is how the speedbump data looks like.
https://i.sstatic.net/7BLjq.png

A sample of the data collected:

 X-Axis     Y-Axis    Z-Axis   Timestamp

-0.371827, 8.513097, 5.441484, 165401
-0.601749, 7.976613, 5.326523, 165601
-0.333506, 8.053253, 5.441484, 165801
-0.256866, 8.206534, 5.364844, 166001
0.049697, 8.398136, 5.364844, 166202
-0.371827, 8.436457, 5.211563, 166400
-0.256866, 8.551417, 5.709726, 166601
-0.256866, 8.513097, 5.403164, 166801
-0.333506, 8.474776, 5.709726, 167000
-0.563428, 8.628057, 5.594766, 167201
-0.563428, 7.401808, 4.713398, 167402
-1.981280, 5.447472, 4.406836, 167602    POTHOLE
-0.180225, 5.600753, 5.403164, 167800    POTHOLE
-0.984952, 8.053253, 4.445156, 168001
-1.214874, 8.666378, 5.671406, 168201
-0.525108, 7.210207, 3.870352, 168401
-1.138233, 7.286847, 5.824687, 168600
-0.601749, 10.045910, 5.288203, 168801
-0.180225, 8.206534, 5.173242, 169001
0.279619, 7.861651, 5.518125, 169200
0.202978, 8.934620, 5.824687, 169401
-0.065264, 8.321495, 5.364844, 169601
-0.065264, 8.628057, 5.709726, 169800
-0.716710, 8.014933, 5.748047, 170001
-0.141905, 8.513097, 5.441484, 170200
-0.026944, 8.206534, 5.594766, 170401
-0.601749, 8.168214, 5.058281, 170601

Algorithm

My proposed algorithm is to set a certain threshold such as line 12 on the sample data when the Y axis hits a certain threshold such as <7 then pass the previous 5 points and the 5 points after that to the NN.

$\endgroup$
3
  • $\begingroup$ How accurate do you think your simple threshold approach is? That is, is the method of simply looking for extreme Y deviation ( < 7 ) already 90% accurate, say? $\endgroup$ Commented Mar 12, 2012 at 21:22
  • $\begingroup$ I have several pothole data graphs and the Y axis goes below 7 at all times. I'm not sure how accurate it is so far since speedbumps can also hit <7 which is why I am using Neural Nets to help for pattern recognition to tell the difference between a pothole and a speed bump. $\endgroup$
    – Unleashed
    Commented Mar 13, 2012 at 0:20
  • $\begingroup$ On the graphs you've given, what is the X axis? Is it time or x-axis acceleration. The two graphs seem to have have dissimilar scales? Out of interest what is the orientation of the accelerometer, is the X axis oriented left/right across vehicle and the Y front to back, with Z vertical? $\endgroup$ Commented Apr 12, 2012 at 13:11

3 Answers 3

1
$\begingroup$

Given your comment, I am guessing that what distinguishes a pothole from a speed bump is largely the vehicle's speed going into the event. I think your idea of looking for outlier Y positions and then passing a surrounding window of data is a great place to start. What this means then is that your training data set will have to have 11 values for each known pattern you have.

If your neural network library has a softmax activation function for the output layer, you can perhaps use a single network to learn and identify potholes, speedbumps, and normal roads.

Alternatively, you can train two separate networks: one network would learn/identify good vs potholes, the other good vs speedbumps. Each new pattern would be given to both networks and you'd consider the output pairs (ideally [0,1] or [1,0]).

As for how large the training set needs to be, start small (e.g. 10 examples of each case), assess out of sample accuracy (so you'll need to reserve some additional known patterns as a hold out set), and then iteratively improve by adding more training patterns and/or changing the network layout and optimization settings. If you happen to be coding this in Python, PyBrain has some nice example documentation.

$\endgroup$
1
$\begingroup$

I'll address your question about the amount of training data.

You seem to have a 2 or 3 class classification problem, does this instance of data belong to pothole, speedbump or perhaps normal road.

Given a finite number of samples, you want to have an estimate of the accuracy of your prediction algorithm. To make this estimate you need to reserve some samples that your algorithm has not been trained on and on which you can measure the accuracy of the classification algorithm you have produced, this is commonly known as the test set.

The more data you use for training the less is available for testing the algorithm's accuracy. Consequently variance of the estimate of accuracy on a small test set will potentially be quite high.

In general, a single partition of the data into training and test sets is unlikely to give an unbiased estimate of accuracy. This is a well trodden path so some standard approaches for producing more reliable estimates exist.

Probably the two most popular are n-fold cross validation, where the whole dataset is partitioned into n disjoint training and test sets. Models are then trained on the training data and tested on the test data for each of the n partitions. Typically n is set to 10, the resulting accuracies from the n trials are then average to produce an overall accuracy figure. Cross Validation.

The second method is repeated hold out, where all the data is randomly partitioned in to two parts, typically 50%/50%, models trained and then tested. Then the resulting accuracies are averaged.

If you are't familiar with them already, toolkits like WEKA or R will have methods for estimating these accuracies and for building neural network and other models ready for you to just use out of the box.

Once you've decided on you're approach to subsampling the time series data you might want to consider comparing performance of other modeling approaches such as random forests or Generalised Linear Models ( GLMs ) which require very little tuning in comparison to neural networks and can give very good performance. A toolkit such as WEKA will make this very easy to experiment with alternate algorithms.WEKA.

I'm not sure if the other samples in your data support these observations, but one would imagine that a pothole would be characterised by a sharp negative z axis acceleration ( z-axis aligned perpendicular to the road surface )followed by a sharp positive z axis acceleration with little time inbetween. A speed bump would be the reverse, sharp +ve z axis followed by sharp -ve z-axis acceleration, with probably a slightly longer duration between the 2 events and a less steep acceleration profile. For the speed bump, the timing of the accelerations will be dependent on the profile of the bump, some have long plateaus, do you have information on the type of humps the data is from?

As you suggest there may well be an accompanying deceleration (in the y-axis, orientation front to back of car ? ) in the case of the speed hump as the driver may have been aware of it and slowed accordingly. This is less likely in the case of a pot hole, but not unknown.

In selecting the region of the time series to use for training you might want to combine the likelihood of the driver decelerating with the z-axis acceleration profiles for the two types of road obstruction to help you choose good regions. It seems likely that framing the correct samples consistently will significantly increase accuracy.

$\endgroup$
-1
$\begingroup$

Not as much as an answer but a question first. I take it the car in the resting state segment is the baseline averaged with your "bumps" potential. I had a problem in anaysing evoked potential data where artifacts, or worse "missing data", were present. SPSS would assign 0 to missing data and bmdp just did a general mean average, therefore with assistance from the math guy in the department we / he designed an algorithm of a zero to next peak analysis. It was not that simple, but pretty close. I will check back later this may not be applicable to your situation.

$\endgroup$
1
  • $\begingroup$ Welcome to the site, @LX_Gould. We appreciate your help with answering questions here. You may want to read our FAQ, which contains information on site policies & how to best help with answering questions. $\endgroup$ Commented Sep 27, 2012 at 12:50

Your Answer

By clicking “Post Your Answer”, you agree to our terms of service and acknowledge you have read our privacy policy.

Not the answer you're looking for? Browse other questions tagged or ask your own question.