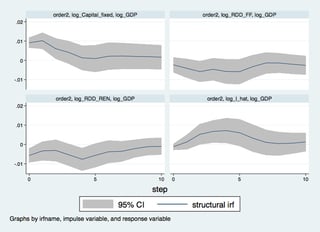
I am estimating a structural VAR Model in levels with $p=3$ and plot orthogonalised impulse response functions.
A structural VAR with p lags (sometimes abbreviated SVAR) is
$B_0 y_t = c_0 + B_1 y_{t-1} + B_2 y_{t-2} + \cdots + B_p y_{t-p} + \epsilon_t,$
where c0 is a k × 1 vector of constants, Bi is a k × k matrix (for every i = 0, ..., p) and $\epsilon_t$ is a k × 1 vector of error terms. The main diagonal terms of the B0 matrix (the coefficients on the ith variable in the ith equation) are scaled to 1.
The error terms $\epsilon_t$ (structural shocks) satisfy 3 conditions in the definition above, with the particularity that all the elements off the main diagonal of the covariance matrix $\mathrm{E}(\epsilon_t\epsilon_t') = \Sigma$ are zero. That is, the structural shocks are uncorrelated.
Afterwards, I am testing the data for co-integration and find $r=3$ co-integration relationships. This, will be used in modelling a VECM using $p=3$. The variables are $R\&D_1,R\&D_2, Capital, Labour, P_E, Output $ where $R\&D_x$ are research and development investments and $P_E$ is the electricity price. Now we want to analyse the impact of shocks to each variable in an impulse response function framework. The results look as following:


While the shape of the 4 functions in general are the same I am very confused by the permanent nature of all the VECM IRFs. According to Lütkepohl's "New Introduction to multiple time series analysis" there should be at most 3 transitory effects as $r=3$, but to me it seems that there are no transitory effects in place. Further, I am wondering if this comparison enables me to conclude that my VAR in levels is correctly specified and co-integration does not cause any bias.
Thanks in advance!
