2
$\begingroup$

I'm trying build a model to predict sells of clothe store for each cluster to month 11 and 12.

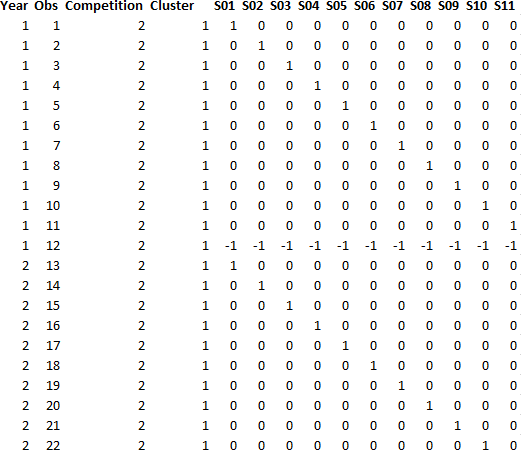
I've 98 stores, and for each store i have this data, but i put the all data to calc only 1 model.

enter image description here

I use R to calc the model, and i have this "Coefficients: (1 not defined because of singularities)" the coefficent is S11. i've already read that it happens because there is correlation between the variables, but i dont know how fix it or if my model is correctly created.

thank you so much!

competition is the level on competition where the store are located (1= low 2=medium 3 = high)

Cluster = 1,2,3,4,5 depends which cluster the store belongs.

S01, S02, S03 ....S11 is the dummies for sazonality. Year, 1= 2015 and 2=2016 Obs= Observation number

$\endgroup$
4
  • $\begingroup$ Please explain what the data mean. Where are the sales? $\endgroup$
    – whuber
    Commented Nov 14, 2016 at 19:42
  • $\begingroup$ i did not add the Sales in the picture, because i thougth that was not necessary. $\endgroup$
    – CFC
    Commented Nov 14, 2016 at 19:57
  • $\begingroup$ I believe it is crucial to explain your data, because your data appear to form a singular matrix (as R has explained) and we cannot provide objective, reasoned recommendations about how to deal with that unless we can understand what the data are intended to mean. $\endgroup$
    – whuber
    Commented Nov 14, 2016 at 20:00
  • $\begingroup$ competition is the level on competition where the store are located (1= low 2=medium 3 = high) Cluster = 1,2,3,4,5 depends which cluster the store belongs. S01, S02, S03 ....S11 is the dummies for sazonality. Year, 1= 2015 and 2=2016 Obs= Observation number Thank you $\endgroup$
    – CFC
    Commented Nov 14, 2016 at 20:02

1 Answer 1

1
$\begingroup$

You probably want to build a separate model for each store as each store may have it's own distinct profile using ARIMA and any needed deterministic structure to deal with fixed monthly effects , level shifts , local time trends and unusual (non-reoccurring ) values. You might also want to incorporate a predictor variable (total stores) as there may be information from overall sales. This is yet another example of parent/child modelling .

edited to correct comment

I authored an article on store sales cannibalization that might be of interest to you How can I analyze / compare point-of-sales data between stores with different product offerings? Essentially the sales of the prospective cannibalizer is used as a possible predictor variable

$\endgroup$
3
  • $\begingroup$ Thank you! But for example, if i want estimated the sells of new store in each cluster and level of competition to know the impact of this variables in monthly sales, the regression model does is the best one to do it? $\endgroup$
    – CFC
    Commented Nov 14, 2016 at 19:54
  • $\begingroup$ I authored an article on store sales cannibalization that might be of interest to you autobox.com/cms/index.php/afs-university/intro-to-forecasting/… . Essentially the sales of the prospective cannibalizer is used as a possible predictor variable ...looks like I need to get the correct link $\endgroup$
    – IrishStat
    Commented Nov 14, 2016 at 20:06
  • $\begingroup$ i'm reading. If you know more references about this theme, i ll apreciated, and all help is welcome! im thankful to you. Thank you so much for your time!!! $\endgroup$
    – CFC
    Commented Nov 14, 2016 at 20:58

Your Answer

By clicking “Post Your Answer”, you agree to our terms of service and acknowledge you have read our privacy policy.

Not the answer you're looking for? Browse other questions tagged or ask your own question.