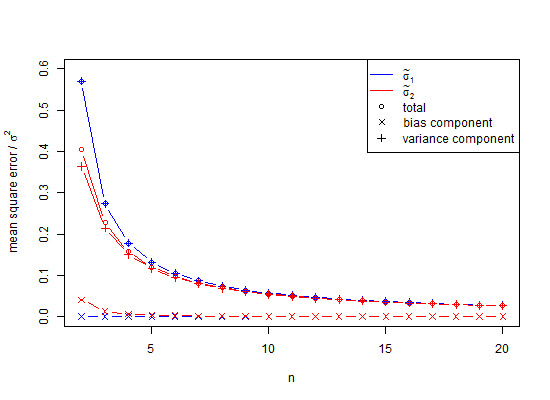
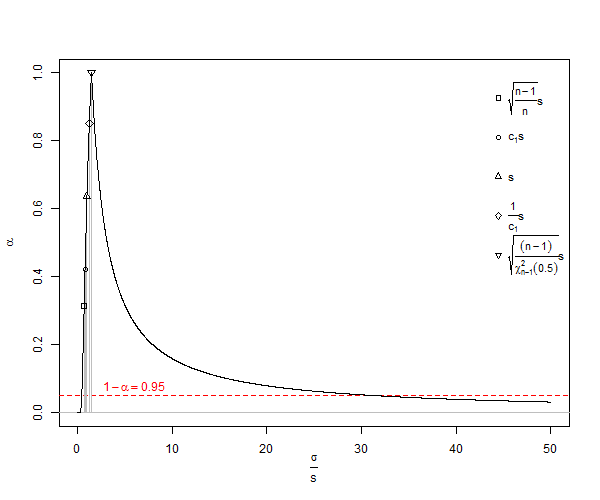
It came as a bit of a shock to me the first time I did a normal distribution Monte Carlo simulation and discovered that the mean of $100$ standard deviations from $100$ samples, all having a sample size of only $n=2$, proved to be much less than, i.e., averaging $ \sqrt{\frac{2}{\pi }}$ times, the $\sigma$ used for generating the population. However, this is well known, if seldom remembered, and I sort of did know, or I would not have done a simulation. Here is a simulation.
Here is an example for predicting 95% confidence intervals of $N(0,1)$ using 100, $n=2$, estimates of $\text{SD}$, and $\text{E}(s_{n=2})=\sqrt\frac{\pi}{2}\text{SD}$.
 RAND()   RAND()    Calc    Calc
 N(0,1)   N(0,1)    SD      E(s)
-1.1171  -0.0627    0.7455  0.9344
 1.7278  -0.8016    1.7886  2.2417
 1.3705  -1.3710    1.9385  2.4295
 1.5648  -0.7156    1.6125  2.0209
 1.2379   0.4896    0.5291  0.6632
-1.8354   1.0531    2.0425  2.5599
 1.0320  -0.3531    0.9794  1.2275
 1.2021  -0.3631    1.1067  1.3871
 1.3201  -1.1058    1.7154  2.1499
-0.4946  -1.1428    0.4583  0.5744
 0.9504  -1.0300    1.4003  1.7551
-1.6001   0.5811    1.5423  1.9330
-0.5153   0.8008    0.9306  1.1663
-0.7106  -0.5577    0.1081  0.1354
 0.1864   0.2581    0.0507  0.0635
-0.8702  -0.1520    0.5078  0.6365
-0.3862   0.4528    0.5933  0.7436
-0.8531   0.1371    0.7002  0.8775
-0.8786   0.2086    0.7687  0.9635
 0.6431   0.7323    0.0631  0.0791
 1.0368   0.3354    0.4959  0.6216
-1.0619  -1.2663    0.1445  0.1811
 0.0600  -0.2569    0.2241  0.2808
-0.6840  -0.4787    0.1452  0.1820
 0.2507   0.6593    0.2889  0.3620
 0.1328  -0.1339    0.1886  0.2364
-0.2118  -0.0100    0.1427  0.1788
-0.7496  -1.1437    0.2786  0.3492
 0.9017   0.0022    0.6361  0.7972
 0.5560   0.8943    0.2393  0.2999
-0.1483  -1.1324    0.6959  0.8721
-1.3194  -0.3915    0.6562  0.8224
-0.8098  -2.0478    0.8754  1.0971
-0.3052  -1.1937    0.6282  0.7873
 0.5170  -0.6323    0.8127  1.0186
 0.6333  -1.3720    1.4180  1.7772
-1.5503   0.7194    1.6049  2.0115
 1.8986  -0.7427    1.8677  2.3408
 2.3656  -0.3820    1.9428  2.4350
-1.4987   0.4368    1.3686  1.7153
-0.5064   1.3950    1.3444  1.6850
 1.2508   0.6081    0.4545  0.5696
-0.1696  -0.5459    0.2661  0.3335
-0.3834  -0.8872    0.3562  0.4465
 0.0300  -0.8531    0.6244  0.7826
 0.4210   0.3356    0.0604  0.0757
 0.0165   2.0690    1.4514  1.8190
-0.2689   1.5595    1.2929  1.6204
 1.3385   0.5087    0.5868  0.7354
 1.1067   0.3987    0.5006  0.6275
 2.0015  -0.6360    1.8650  2.3374
-0.4504   0.6166    0.7545  0.9456
 0.3197  -0.6227    0.6664  0.8352
-1.2794  -0.9927    0.2027  0.2541
 1.6603  -0.0543    1.2124  1.5195
 0.9649  -1.2625    1.5750  1.9739
-0.3380  -0.2459    0.0652  0.0817
-0.8612   2.1456    2.1261  2.6647
 0.4976  -1.0538    1.0970  1.3749
-0.2007  -1.3870    0.8388  1.0513
-0.9597   0.6327    1.1260  1.4112
-2.6118  -0.1505    1.7404  2.1813
 0.7155  -0.1909    0.6409  0.8033
 0.0548  -0.2159    0.1914  0.2399
-0.2775   0.4864    0.5402  0.6770
-1.2364  -0.0736    0.8222  1.0305
-0.8868  -0.6960    0.1349  0.1691
 1.2804  -0.2276    1.0664  1.3365
 0.5560  -0.9552    1.0686  1.3393
 0.4643  -0.6173    0.7648  0.9585
 0.4884  -0.6474    0.8031  1.0066
 1.3860   0.5479    0.5926  0.7427
-0.9313   0.5375    1.0386  1.3018
-0.3466  -0.3809    0.0243  0.0304
 0.7211  -0.1546    0.6192  0.7760
-1.4551  -0.1350    0.9334  1.1699
 0.0673   0.4291    0.2559  0.3207
 0.3190  -0.1510    0.3323  0.4165
-1.6514  -0.3824    0.8973  1.1246
-1.0128  -1.5745    0.3972  0.4978
-1.2337  -0.7164    0.3658  0.4585
-1.7677  -1.9776    0.1484  0.1860
-0.9519  -0.1155    0.5914  0.7412
 1.1165  -0.6071    1.2188  1.5275
-1.7772   0.7592    1.7935  2.2478
 0.1343  -0.0458    0.1273  0.1596
 0.2270   0.9698    0.5253  0.6583
-0.1697  -0.5589    0.2752  0.3450
 2.1011   0.2483    1.3101  1.6420
-0.0374   0.2988    0.2377  0.2980
-0.4209   0.5742    0.7037  0.8819
 1.6728  -0.2046    1.3275  1.6638
 1.4985  -1.6225    2.2069  2.7659
 0.5342  -0.5074    0.7365  0.9231
 0.7119   0.8128    0.0713  0.0894
 1.0165  -1.2300    1.5885  1.9909
-0.2646  -0.5301    0.1878  0.2353
-1.1488  -0.2888    0.6081  0.7621
-0.4225   0.8703    0.9141  1.1457
 0.7990  -1.1515    1.3792  1.7286

 0.0344  -0.1892    0.8188  1.0263  mean E(.)
                    SD pred E(s) pred
-1.9600  -1.9600   -1.6049 -2.0114    2.5%  theor, est
 1.9600   1.9600    1.6049  2.0114   97.5%  theor, est
                    0.3551 -0.0515    2.5% err
                   -0.3551  0.0515   97.5% err
Drag the slider down to see the grand totals. Now, I used the ordinary SD estimator to calculate 95% confidence intervals around a mean of zero, and they are off by 0.3551 standard deviation units. The E(s) estimator is off by only 0.0515 standard deviation units. If one estimates standard deviation, standard error of the mean, or t-statistics, there may be a problem.
My reasoning was as follows, the population mean, $\mu$, of two values can be anywhere with respect to a $x_1$ and is definitely not located at $\frac{x_1+x_2}{2}$, which latter makes for an absolute minimum possible sum squared so that we are underestimating $\sigma$ substantially, as follows
w.l.o.g. let $x_2-x_1=d$, then $\Sigma_{i=1}^{n}(x_i-\bar{x})^2$ is $2 (\frac{d}{2})^2=\frac{d^2}{2}$, the least possible result.
That means that standard deviation calculated as
$\text{SD}=\sqrt{\frac{\Sigma_{i=1}^{n}(x_i-\bar{x})^2}{n-1}}$ ,
is a biased estimator of the population standard deviation ($\sigma$). Note, in that formula we decrement the degrees of freedom of $n$ by 1 and dividing by $n-1$, i.e., we do some correction, but it is only asymptotically correct, and $n-3/2$ would be a better rule of thumb. For our $x_2-x_1=d$ example the $\text{SD}$ formula would give us $SD=\frac{d}{\sqrt 2}\approx 0.707d$, a statistically implausible minimum value as $\mu\neq \bar{x}$, where a better expected value ($s$) would be $E(s)=\sqrt{\frac{\pi }{2}}\frac{d}{\sqrt 2}=\frac{\sqrt\pi }{2}d\approx0.886d$. For the usual calculation, for $n<10$, $\text{SD}$s suffer from very significant underestimation called small number bias, which only approaches 1% underestimation of $\sigma$ when $n$ is approximately $25$. Since many biological experiments have $n<25$, this is indeed an issue. For $n=1000$, the error is approximately 25 parts in 100,000. In general, small number bias correction implies that the unbiased estimator of population standard deviation of a normal distribution is
$\text{E}(s)\,=\,\,\frac{\Gamma\left(\frac{n-1}{2}\right)}{\Gamma\left(\frac{n}{2}\right)}\sqrt{\frac{\Sigma_{i=1}^{n}(x_i-\bar{x})^2}{2}}>\text{SD}=\sqrt{\frac{\Sigma_{i=1}^{n}(x_i-\bar{x})^2}{n-1}}\; .$
From Wikipedia under creative commons licensing one has a plot of SD underestimation of $\sigma$ ![<a title="By Rb88guy (Own work) [CC BY-SA 3.0 (http://creativecommons.org/licenses/by-sa/3.0) or GFDL (http://www.gnu.org/copyleft/fdl.html)], via Wikimedia Commons" href="https://commons.wikimedia.org/wiki/File%3AStddevc4factor.jpg"><img width="512" alt="Stddevc4factor" src="https://upload.wikimedia.org/wikipedia/commons/thumb/e/ee/Stddevc4factor.jpg/512px-Stddevc4factor.jpg"/></a>](https://i.sstatic.net/q2BX8.jpg)
Since SD is a biased estimator of population standard deviation, it cannot be the minimum variance unbiased estimator MVUE of population standard deviation unless we are happy with saying that it is MVUE as $n\rightarrow \infty$, which I, for one, am not.
Concerning non-normal distributions and approximately unbiased $SD$ read this.
Now comes the question Q1
Can it be proven that the $\text{E}(s)$ above is MVUE for $\sigma$ of a normal distribution of sample-size $n$, where $n$ is a positive integer greater than one?
Hint: (But not the answer) see How can I find the standard deviation of the sample standard deviation from a normal distribution?.
Next question, Q2
Would someone please explain to me why we are using $\text{SD}$ anyway as it is clearly biased and misleading? That is, why not use $\text{E}(s)$ for most everything? Supplementary, it has become clear in the answers below that variance is unbiased, but its square root is biased. I would request that answers address the question of when unbiased standard deviation should be used.
As it turns out, a partial answer is that to avoid bias in the simulation above, the variances could have been averaged rather than the SD-values. To see the effect of this, if we square the SD column above, and average those values we get 0.9994, the square root of which is an estimate of the standard deviation 0.9996915 and the error for which is only 0.0006 for the 2.5% tail and -0.0006 for the 95% tail. Note that this is because variances are additive, so averaging them is a low error procedure. However, standard deviations are biased, and in those cases where we do not have the luxury of using variances as an intermediary, we still need small number correction. Even if we can use variance as an intermediary, in this case for $n=100$, the small sample correction suggests multiplying the square root of unbiased variance 0.9996915 by 1.002528401 to give 1.002219148 as an unbiased estimate of standard deviation. So, yes, we can delay using small number correction but should we therefore ignore it entirely?
The question here is when should we be using small number correction, as opposed to ignoring its use, and predominantly, we have avoided its use.
Here is another example, the minimum number of points in space to establish a linear trend that has an error is three. If we fit these points with ordinary least squares the result for many such fits is a folded normal residual pattern if there is non-linearity and half normal if there is linearity. In the half-normal case our distribution mean requires small number correction. If we try the same trick with 4 or more points, the distribution will not generally be normal related or easy to characterize. Can we use variance to somehow combine those 3-point results? Perhaps, perhaps not. However, it is easier to conceive of problems in terms of distances and vectors.


