I have a limited statistics background, so I will try to be as specific as possible.
I'm reading a paper on a method to fingerprint mobile devices using their accelerometer. To demonstrate that the method is robust, the author measures parameters from 16.000 devices; I don't know if it's relevant, but the parameters are the Offset (O) and the Sensibility (S) of the sensor.
He then filter them by keeping only the values of devices which has been measured exactly twice. For every device, he calculates the "distance" between every O, and then between every S. He finds out that
The 95th percentile for O distance is 0.045. For S this distance is 0.0037.
First question: what does that mean? Moreover, what is the 95th percentile, and why does he use it?
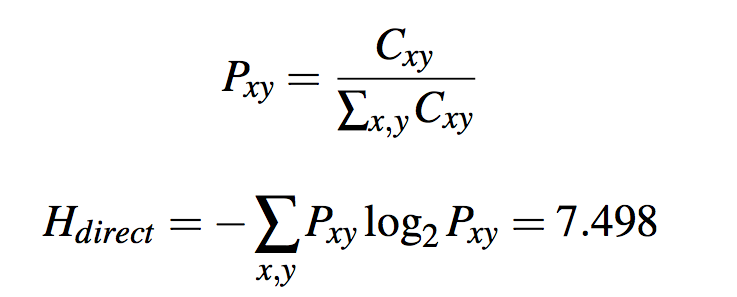
He then uses these 95th percentile distances to create a scatter plot of O-S, dividing it into blocks of equal size and counting the data points in each block (Cxy). From this he is able to calculate overall entropy of the distribution (which he does not define) as follows:
Second question: what does the entropy tells me? I know it's a measure of disorder in a system, so I assume that it says something like "there are no clusters of similar informations, all the informations are disordered in the graph". But, how much? Shouldn't I compare this value with something?
The paragraph is then concluded saying that
Small variations of the grid origin had minimal effects on the entropy estimate (specifically, we saw less than 0.01 bit of entropy difference between the smallest and largest estimated value, 7.493 vs. 7.502). We consider this to be a confirmation that the result is robust.
Sorry for the long quote, but I really can't figure out what does that mean: what does it tell me if entropy has a small variation between the smaller and the largest estimated value? That's the third question.
You can find the paper here: Paper

