1
$\begingroup$

I am having problems to interpret the output of lme on my model. Here is the model;

model2 <- lme(Kfs~Density+Treat+Year, data=inf, random=~1|SiteNo/Plot, na.action=na.omit).

Kfs is Field- saturated hydraulic connectivity and Density is Bulk Density and these values measured $2$ times in $2$ years, so they are repeated measurements. These were measured on $5$ or $6$ different treatment types, so Treat means Treatments. I had $3$ different sites and many plots in each site. I used plot and sites as random part because we did not know where to make these measurements, so they were randomly selected.

Here is another question, Does R recognize the repeated measurements from the model or should I need to add more things?

I also added the output of the model to get help interpreting it.

enter image description here


Can you give me more details because they look all have different intercept and the slope? My purpose is to understand what is the statistical difference between Treat types especially between L, LSC, and MP.

I looked at some more details and I found how they make R recognize the repeated measurements. Here is the new code; see the new outputs enter image description here

enter image description here

Output of lme from the last model.


enter image description here

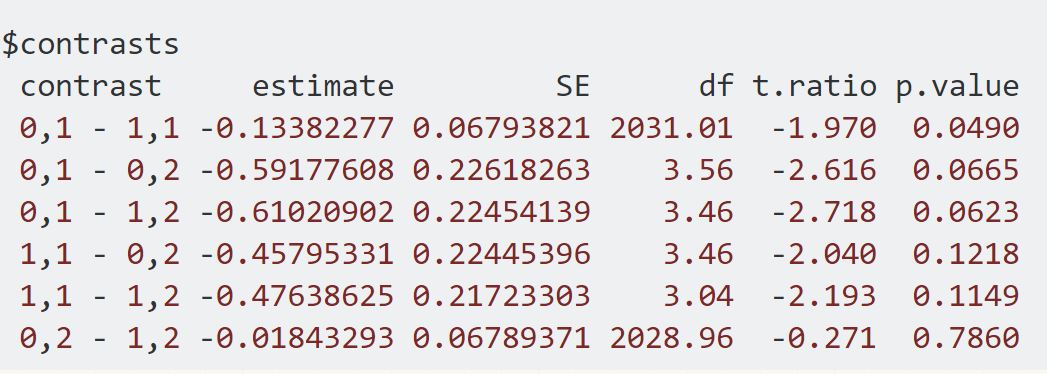
This is output lsmeans. I want to interpret this but There is no p-value, I need help how to add P-value and I also gave an example that is what I want to get from output lsmeans.


enter image description here

That is what I want to get if it is possible to get from lsmeans.

$\endgroup$
6
  • $\begingroup$ To test for differences in those treatment groups you'd need to set up the dummy variables so, for example, L is the reference level, in which case the coefficient for LSC would quantify the difference between those two groups (and you can look at the corresponding p-value). To test for overall heterogeneity between the treatment groups, compare this model with the one that excludes the treatment variable complete (e.g. using a likelihood ratio test). $\endgroup$
    – gammer
    Commented Jan 30, 2017 at 5:13
  • $\begingroup$ Thanks for the answer! I changed some part of data and combined treat and year. I called it "Mix". Because when I run the model with year and as interaction term It gave this "Error in MEEM(object, conLin, control$niterEM) : Singularity in backsolve at level 0, block 1" I decided run model diffrently but instead of interpreting output of new model, I ran this lsmeansand I got the output which is below. The problem is I want to see p-value, but model did not give that. My question is How to get P value to output of the lsmeans? $\endgroup$
    – Iskender
    Commented Feb 3, 2017 at 7:22
  • $\begingroup$ Please, see output of lme and lsmeans. There is also extra output of lsmeans which is what I want. $\endgroup$
    – Iskender
    Commented Feb 3, 2017 at 7:24
  • $\begingroup$ @lskender, I don't know. Maybe use the CI and, based on the Gaussian distribution, approximate the p-value. Or get down under the hood and figure out where the p-value is (if anywhere). Or ask on stackoverflow. By the way, all the things you posted below aren't answers, so maybe post them as edits to your question rather than answers. $\endgroup$
    – gammer
    Commented Feb 5, 2017 at 0:40
  • $\begingroup$ Please use the edit link on your question to add additional information. The Post Answer button should be used only for complete answers to the question. - From Review $\endgroup$ Commented Feb 5, 2017 at 1:43

1 Answer 1

1
$\begingroup$

Yes, it looks like R recognizes the plot and site level random effects. Based on this output, it looks like the intraclass correlation is very low, because the estimate of the residual variance ($\approx .005^2$) is multiple orders of magnitude larger than the estimates of both the site level ($\approx .0008^2$) and and plot level ($\approx .00000029^2$) random effect variances.

$\endgroup$

Your Answer

By clicking “Post Your Answer”, you agree to our terms of service and acknowledge you have read our privacy policy.

Not the answer you're looking for? Browse other questions tagged or ask your own question.