I'm new to this forum but already have my first question. I'm a biology student, thus my knowledge about statistics in general is rather low ;)
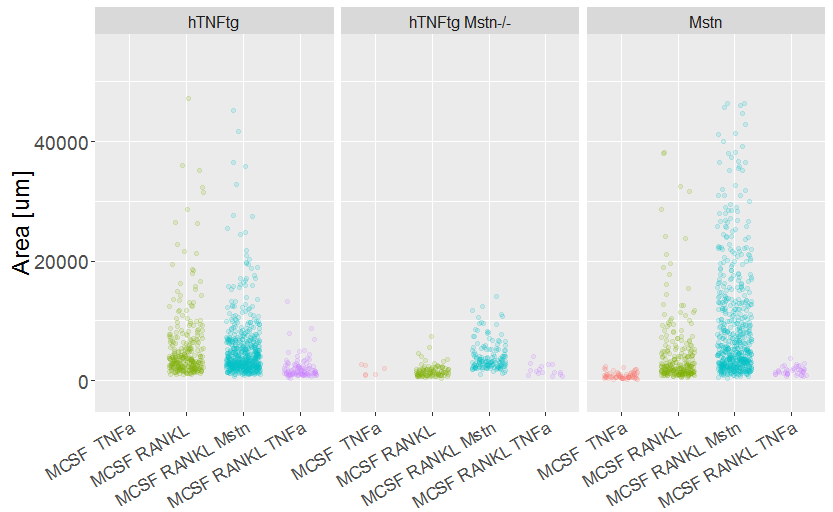
I've measured the size of cells of different genotypes and treated with different growth factors and got the diagram below:

Each facet represents another genotype whereas the x axis gives the different treatments. Each point represents one cell. As you can see, the groups differ in the number of cells and their size.
I now want to know whether there are significant differences between these groups. My first approach was to simply count the cells, calculate the mean and standard deviation and using the Tukey's Range Test as exemplified for the hTNFtg Genotype.
cdata <- ddply(filter(Osteoclasts, Area < 50000),
           c("Genotype", "Stimulants"),
           summarise,
           N = length(Area),
           mean = mean(Area),
           sd = sd(Area))

Significance.hTNFtg <- aov(Area ~ Stimulants, filter(Osteoclasts, Genotype == "hTNFtg", Area < 50000))

Significance.hTNFtg.Table <- TukeyHSD(Significance.hTNFtg)
However, it came to my mind that one assumption for the Tukey's Test is normally distributed data and this is not the case for my data.
Can anyone help me? A small guide on which test to use would be quite helpful.
