20
$\begingroup$

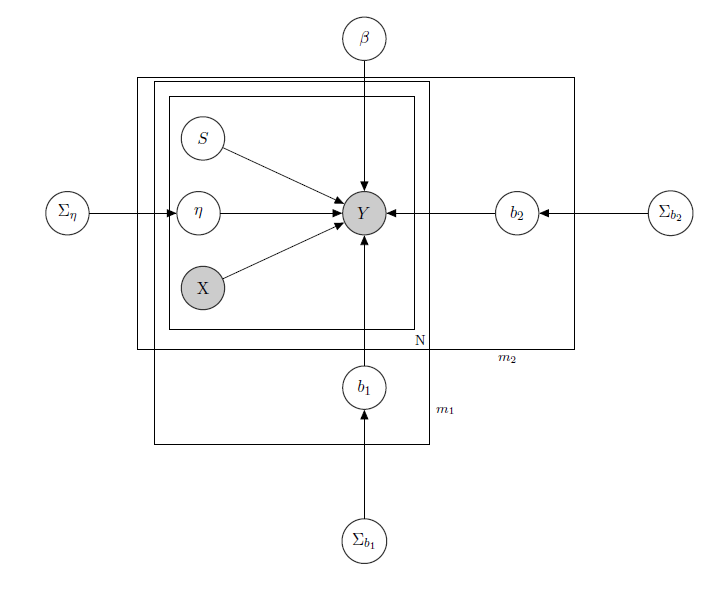
I'm dealing with a Bayesian Hierarchical Linear Model, here the network describing it.

Graphical Model describing the problem

$Y$ represents daily sales of a product in a supermarket(observed).

$X$ is a known matrix of regressors, including prices, promotions, day of the week, weather, holidays.

$S$ is the unknown latent inventory level of each product, which causes the most problems and which I consider a vector of binary variables, one for each product with $1$ indicating stockout and so the unavailability of the product. Even if in theory unknown I estimated it through a HMM for each product, so it is to be considered as known as X. I just decided to unshade it for proper formalism.

$\eta$ is a mixed effect parameter for any single product where the mixed effects considered are the product price, promotions and stockout.

$\beta$ is the vector of fixed regression coefficients, while $b_1$ and $b_2$ are the vectors of mixed effects coefficient. One group indicates brand and the other indicates flavour (this is an example, in reality I have many groups, but I here report just 2 for clarity).

$\Sigma_{\eta}$ , $\Sigma_{b_1}$ and $\Sigma_{b_2}$ are hyperparameters over the mixed effects.

Since i have count data let's say that I treat each product sales as Poisson distributed conditional on the Regressors (even if for some products the Linear approximation holds and for others a zero inflated model is better). In such a case I would have for a product $Y$ (this is just for who's interested in the bayesian model itself, skip to the question if you find it uninteresting or non trivial :)):

$\Sigma_{\eta} \sim IW(\alpha_0,\gamma_0)$

$\Sigma_{b_1} \sim IW(\alpha_1,\gamma_1)$

$\Sigma_{b_2} \sim IW(\alpha_2,\gamma_2)$, $\alpha_0,\gamma_0,\alpha_1,\gamma_1,\alpha_2,\gamma_2$ known.

$\eta \sim N(\mathbf{0},\Sigma_{\eta})$

$b_1 \sim N(\mathbf{0},\Sigma_{b_1})$

$b_2 \sim N(\mathbf{0},\Sigma_{b_2})$

$\beta \sim N(\mathbf{0},\Sigma_{\beta})$, $\Sigma_{\beta}$ known.

$\lambda _{tijk} = \beta*X_{ti} + \eta_i*X_{pps_{ti}} + b_{1_j} * Z_{tj} + b_{2_k} Z_{tk} $,

$ Y_{tijk} \sim Poi(exp(\lambda_{tijk})) $

$i \in {1,\dots,N}$, $j \in {1,\dots,m_1}$, $k \in {1,\dots,m_2}$

$Z_i$ matrix of mixed effects for the 2 groups, $X_{pps_i}$ indicating price, promotion and stockout of product considered. $IW$ indicates inverse Wishart distributions, usually used for covariance matrices of normal multivariate priors. But it's not important here. An example of a possible $Z_i$ could be the matrix of all the prices, or we could even say $Z_i=X_i$. As regards the priors for the mixed-effects variance-covariance matrix, I would just try to preserve the correlation between the entries, so that $\sigma_{ij}$ would be positive if $i$ and $j$ are products of the same brand or either of the same flavour.

The intuition behind this model would be that the sales of a given product depend on its price, its availability or not, but also on the prices of all the other products and the stockouts of all the other products. Since I don't want to have the same model (read: same regression curve) for all the coefficients, I introduced mixed effects which exploit some groups I have in my data, through parameter sharing.

My questions are:

  1. Is there a way to transpose this model to a neural network architecture? I know that there are many questions looking for the relationships between bayesian network, markov random fields, bayesian hierarchical models and neural networks, but I didn't find anything going from the bayesian hierarchical model to neural nets. I ask the question about neural networks since, having a high dimensionality of my problem (consider that I have 340 products), parameter estimation through MCMC takes weeks (I tried just for 20 products running parallel chains in runJags and it took days of time). But I don't want to go random and just give data to a neural network as a black box. I would like to exploit the dependence/independence structure of my network.

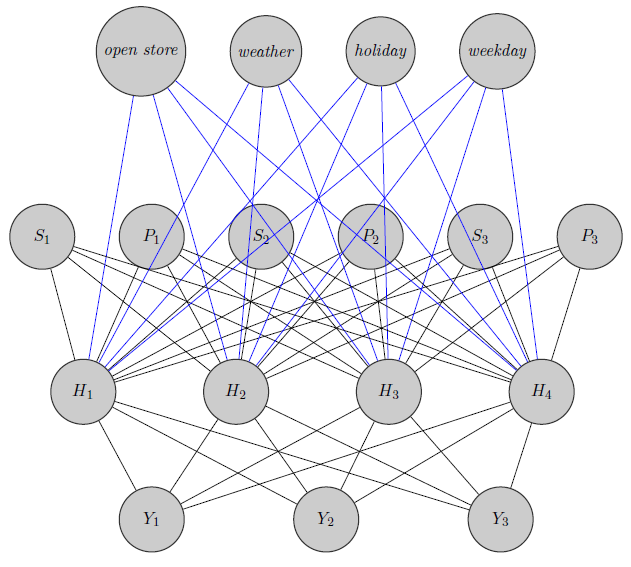
Here I just sketched a neural network. As you see, regressors($P_i$ and $S_i$ indicate respectively price and stockout of product $i$) at the top are inputed to the hidden layer as are those product specific (Here I considered prices and stockouts). (Blue and black edges have no particular meaning, it was just to make the figure more clear) . Furthermore $Y_1$ and $Y_2$ could be highly correlated while $Y_3$ could be a totally different product (think about 2 orange juices and red wine), but I don't use this information in neural networks. I wonder if the grouping information is used just in weight inizialization or if one could customize the network to the problem.

puppet example of a neural net

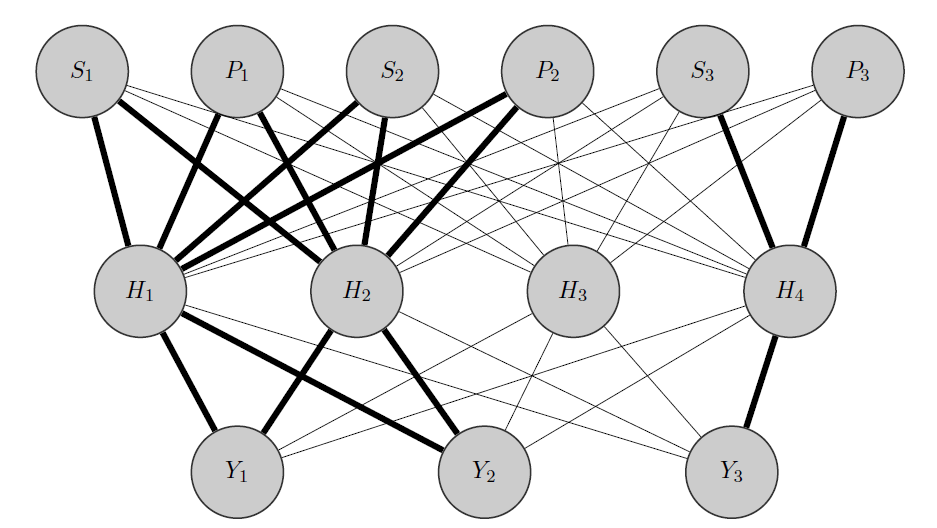
Edit, my idea:

Possible initialization?

My idea would be something like this: as before, $Y_1$ and $Y_2$ are correlated products, while $Y_3$ is a totally different one. Knowing this a priori I do 2 things:

  1. I preallocate some neurons in the hidden layer to any group I have, in this case I have 2 groups {($Y_1,Y_2$),($Y_3$)}.
  2. I initialize high weights between the inputs and the allocated nodes (the bold edges) and of course I build other hidden nodes to capture the remaining 'randomness' in the data.

Thank you in advance for your help

$\endgroup$
7
  • $\begingroup$ @Tomasso Guerrini here is possible the answer for you: stats.stackexchange.com/questions/4498/… $\endgroup$ Commented Feb 11, 2017 at 7:22
  • 1
    $\begingroup$ Have you tried Stan, or it's not feasible for your problem? Hamiltonian Monte Carlo can be orders of magnitude faster than Gibbs sampling, and scales well to hundreds (or even thousands) of variables. $\endgroup$
    – lacerbi
    Commented Mar 28, 2017 at 0:09
  • $\begingroup$ Yes I've tried it, actually I used just STAN,not any other sampling software. For less complex models (for instance not considering mixed effects over brand) and for each product $\lambda_{itjk} = \boldsymbol{\beta} \mathbf{X_t} + \boldsymbol{\eta}_i * \mathbf{Z_{it}}$ it works fine and I'm able to make good inference about what happens.. When increasing complexity I have some convergence problems: I may miss something in my models, but I think the data don't help too since I have lot of skewed predictors, missing data et cetera.. $\endgroup$ Commented Mar 28, 2017 at 0:30
  • 1
    $\begingroup$ Have you tried posing the same question(s) to the Stan users mailing list? They are usually extremely helpful with technical aspects to make a model work. For example, it's possible that issues in your case can be solved with a better parameterization. (Hamiltonian Monte Carlo should mix much faster than Gibbs sampling.) $\endgroup$
    – lacerbi
    Commented Mar 28, 2017 at 0:43
  • 1
    $\begingroup$ Probably it's better to say I spammed that mailing list .. Thank you very much Luigi by the way.. I'm in that situation where I have no more time to dig into the problems as I should, since I have an incoming deadline.. It seems like STAN is a great tool, but the learning curve is a little steep to really realize its incredible performance (as of now I realized its speed up wrt JAGS) $\endgroup$ Commented Mar 28, 2017 at 0:50

1 Answer 1

1
$\begingroup$

For the record, I don't view this as an answer, but just a long comment ! The PDE (heat equation) that is used to model the flow of heat through a metal rod can also be used to model option pricing. No one that I know of has ever tried to suggest a connection between option pricing and heat flow per se. I think that the quote from Danilov's link is saying the same thing. Both Bayesian Graphs and Neural Nets use the language of graphs to express the relations between their different internal pieces. However, Bayesian graphs tells one about the correlation structure of the input variables and the graph of a neural net tells one how to build the prediction function from the input variables. These are very different things.
Various methods used in DL attempt to 'chose' the most important variables, but that is an empirical issue. It also doesn't tell one about the correlation structure of either the entire set of variables or the remaining variables. It merely suggests that the surviving variables will be best for prediciton. For example if one looks at neural nets, one will be led to the German credit data set, which has, if I recall correctly, 2000 data points and 5 dependent variables. Through trial and error I think you will find that a net with only 1 hidden layer and using only 2 of the variables gives the best results for prediction. However, this can only be discovered by building all the models and testing them on the independent testing set.

$\endgroup$
7
  • $\begingroup$ I don't get your comparison with the application of the same model on different data: here the data is the same and the model are different not the other way around. Furthermore I am not trying to make inference on the correlation structure of my variables using a neural net, that is already well achieved through the bayesian posteriors inference. The graph was just to picture what happens in the hierarchical model, so I don't understand the 'language of graphs' thing (Yet I may have misled you with the title, but I needed a catchy one :D ) $\endgroup$ Commented Feb 12, 2017 at 17:03
  • $\begingroup$ And perhaps I don't understand your question. I still think the point is that the way the edges are created in the two graph structures have nothing to do with each other. One could just define a neural net with a given set of edges and weights, but one has no reason to think that such a net will be either accurate or useful. The heart of creating a neural net is to use something akin to back-propagation to let the data determine the 'correct' weights. $\endgroup$
    – meh
    Commented Feb 14, 2017 at 3:20
  • $\begingroup$ "The graph was just to picture what happens in the hierarchical model". We agree that in one case we define the covariance structure and the model is very well interpretable a posteriori, while in the other we let gradient descent do the work and even if not interpretable it usually (as in my case) results in good performances. My question is: is there a way to mantain interpretability while not losing predicting performance? That's why I asked this on stack and that's why I propose that idea in the edit, I'm looking for ideas . I hope now it's clear to you. $\endgroup$ Commented Feb 14, 2017 at 13:27
  • $\begingroup$ One can't prove a negative, so I can't conclusively say there is no connection between the graphs of Bayesian Networks and those of neural nets. I can say that I have no knowledge of such a connection and that I am deeply skeptical of any connection. While one can use the graph structure of the Bayesian network to give the graph structure for the neural network, from a neural network point of view this doesn't seem reasonable. I don't currently have the time to work out the details, but as a thought experiment imagine a data set where the independent variables were all statisitically $\endgroup$
    – meh
    Commented Feb 15, 2017 at 14:05
  • $\begingroup$ I don't currently have the time to work out the details, but as a thought experiment imagine a data set where the independent variables were all statisitically significant, but were not all correlated. For example $ y = \sum x_i + \sum z_i $ where $ z_i = A \times \sigma^{-1}(x_i) $ with A very large in absolute value and $\sigma$ the (non-linear) activation function of the network. Because of the non-linear relationship of y and the z one could have that the correlation between y and the $z_i$ is approximately zero. Yet they should be a part of any good model. $\endgroup$
    – meh
    Commented Feb 15, 2017 at 14:11

Your Answer

By clicking “Post Your Answer”, you agree to our terms of service and acknowledge you have read our privacy policy.

Not the answer you're looking for? Browse other questions tagged or ask your own question.