5
$\begingroup$

I have a set of data with continuous features $x_1, x_2,...,x_n$, as well as a continuous $y$ which is some complicated, unknown function of the $x_i$. Each data point, furthermore, has a discrete label (category). I want to somehow quantify which variables $x_i$ are most responsible for the variance of $y$ between the groups.

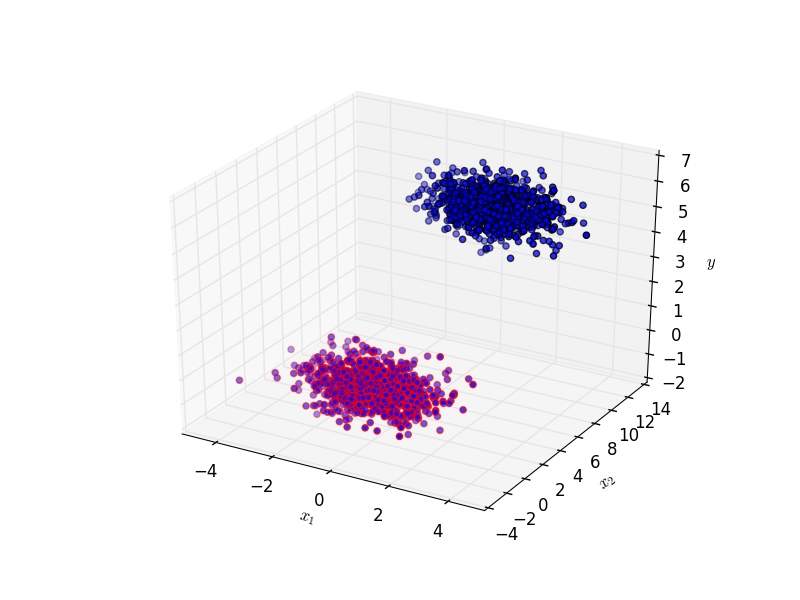
Below is a simple example. The blue and red dots are in different categories. Clearly most of the variation in $y$ between the two categories is due to $x_2$.

enter image description here

Are there any statistical methods that I can use for this?

$\endgroup$
9
  • 4
    $\begingroup$ PCA won't really help here - you're interested in the variance of the output, not in dimensionality reduction. I suggest to first of all include a sample data set in your question, so that it's more clear what you're talking about. Secondly, are you interested in testing whether the mean of $y$ is different across the groups, while controlling for the values of $\mathbf{x}=(x_1,\dots,x_n)$ ? Then search this site for questions related to ANCOVA. [1/2] $\endgroup$
    – DeltaIV
    Commented Feb 27, 2017 at 11:04
  • $\begingroup$ Thanks! I added a simple example. ANCOVA is not quite what I'm looking for. I don't need to test whether the mean is different, but instead which variables are most responsible for the differences in the means (whether they be significant or not). I'm not modelling the category as an independent variable affecting $y$ the way ANCOVA does; rather, I'm assuming that $y$ will be different across categories because of their respective distributions of $x_1,\ldots,x_n$, and trying to find which $x_i$ are most significant in determining the variance between the categories. $\endgroup$
    – Hypercube
    Commented Feb 27, 2017 at 12:19
  • $\begingroup$ I understand. In your example, it looks like the category is just some dichotomization of $y$. In other words, $\mathbf{x}\in C_i \triangleq y\in[l_i,l_{i+1}]$ where $l_1,\dots l_m$ are a set of thresholds. Is this correct? $\endgroup$
    – DeltaIV
    Commented Feb 27, 2017 at 12:43
  • $\begingroup$ No, I just made it like that to better illustrate the problem, but in the real data there is substantial overlap and no clear thresholds, unfortunately. $\endgroup$
    – Hypercube
    Commented Feb 27, 2017 at 20:20
  • 1
    $\begingroup$ got it. Would a classifier be useful to you? In other words, train a model which, given $\mathbf{x}$, predicts the class label $C$. Then, find which variables are most important for classification. This is very easy for single class problems, which I bet is not your case. It's still possible to find a solution for multiclass problems, but first of all let me know if this would help you. $\endgroup$
    – DeltaIV
    Commented Feb 28, 2017 at 17:07

1 Answer 1

-1
$\begingroup$

There are several options available, you can look into principal component analysis (PCA), and run it on each of your groups and compare the results. For example, FactoMineR package in R can help you accomplish this, as well as incorporate qualitative (categorical variables).

$\endgroup$
2
  • $\begingroup$ Thank you for the answer! This R package looks very useful. I don't understand how you're suggesting to use PCA though. One idea I've had is to run PCA on the entire dataset, finding some principal components (PCs) that explain most of the variance, and then to calculate the mean value of the PCs for each class. By finding the PC axes along which the class means are furthest apart, I will have some idea of which of the original $x_i$ are most responsible for the variance between classes. I'm not sure whether this is sensible. $\endgroup$
    – Hypercube
    Commented Feb 27, 2017 at 10:04
  • $\begingroup$ Yes, that is what I was thinking as well, except, what if the different groups have different principal components? Maybe it would be best to calculate the principal components separately for each class. From there, you can compare principal components between classes by taking the variance of their means. If a principal component is found in one class, and no the other, you could give it a mean value of zero to the class where it is not found. Then, the largest variance would suggest that the effect of this PC differs strongly between groups. $\endgroup$
    – ekatko1
    Commented Feb 27, 2017 at 19:21

Your Answer

By clicking “Post Your Answer”, you agree to our terms of service and acknowledge you have read our privacy policy.

Not the answer you're looking for? Browse other questions tagged or ask your own question.