10
$\begingroup$

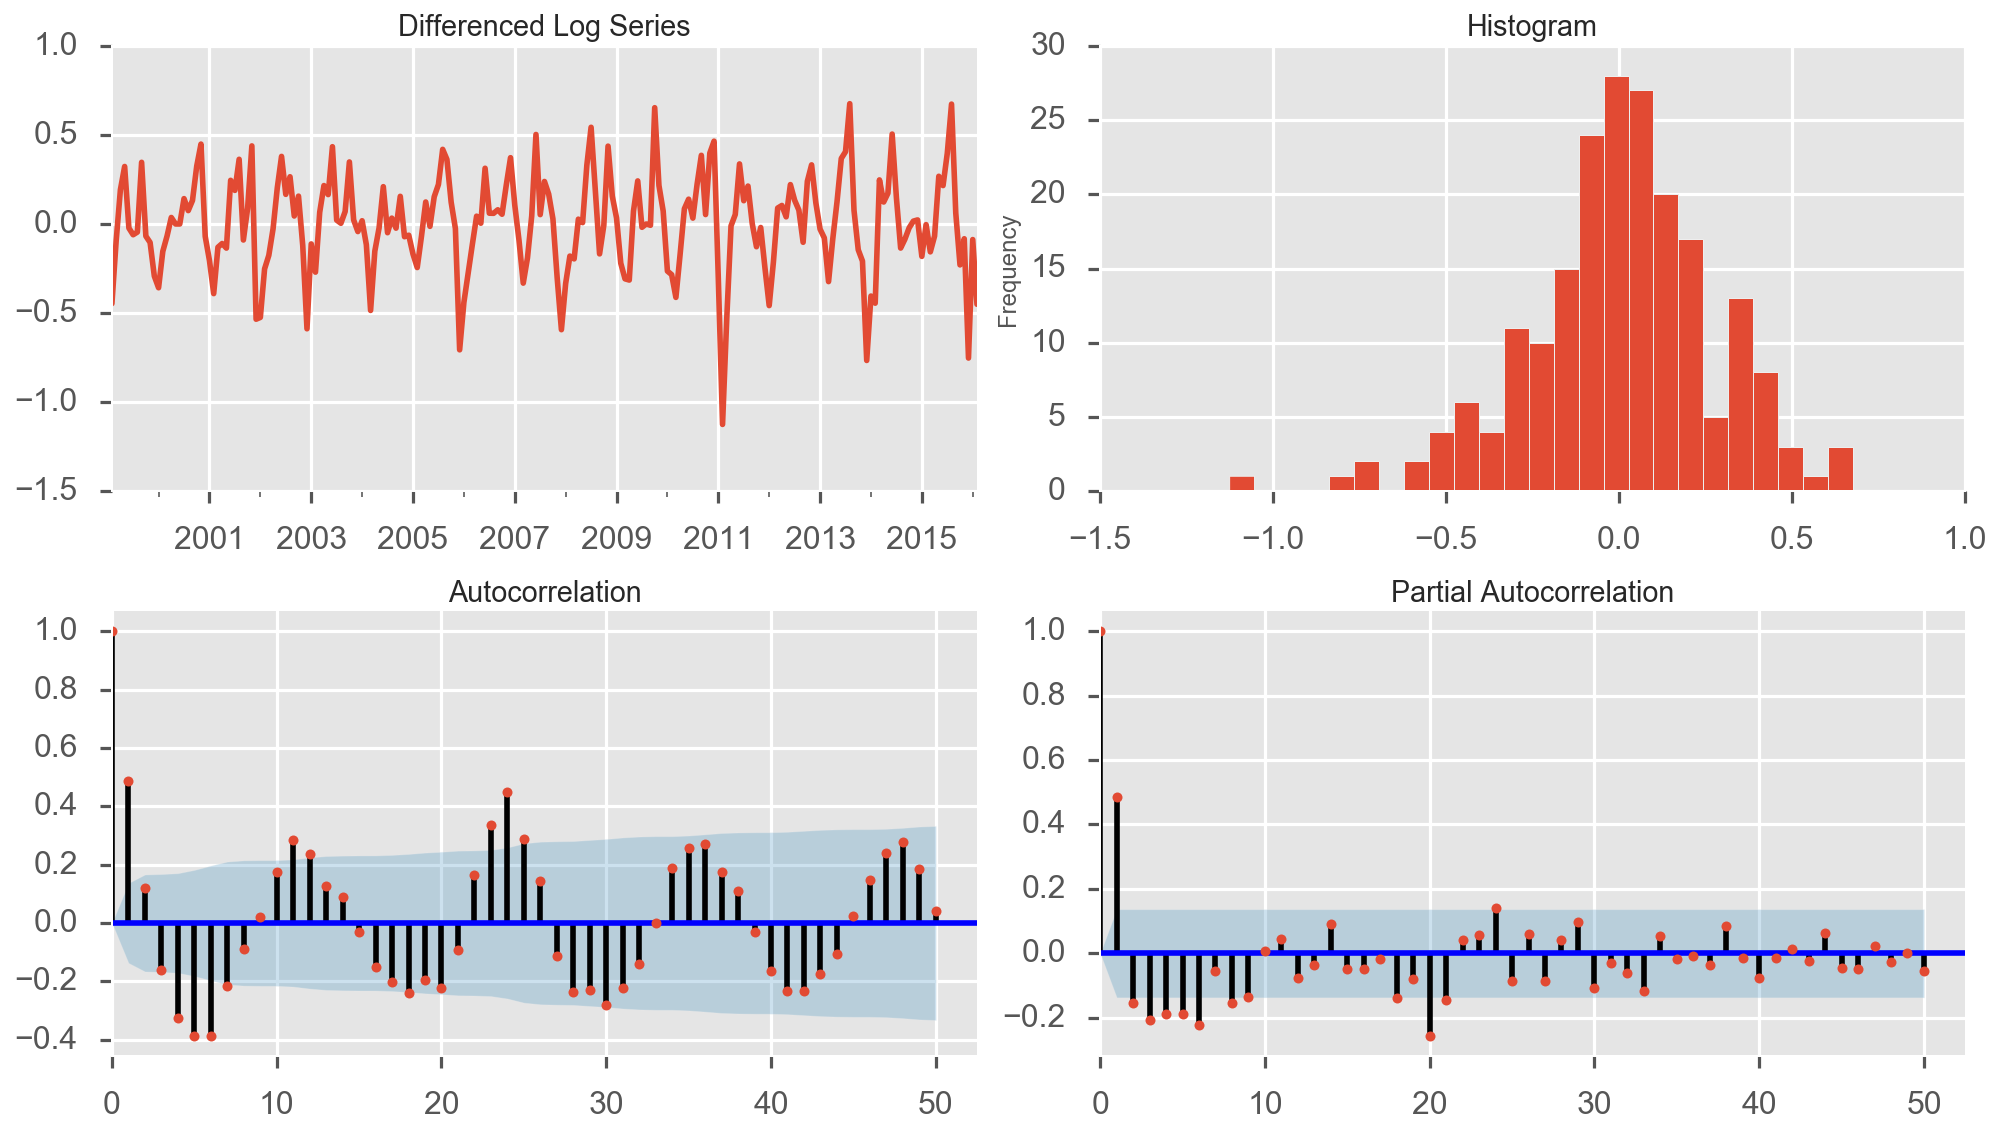
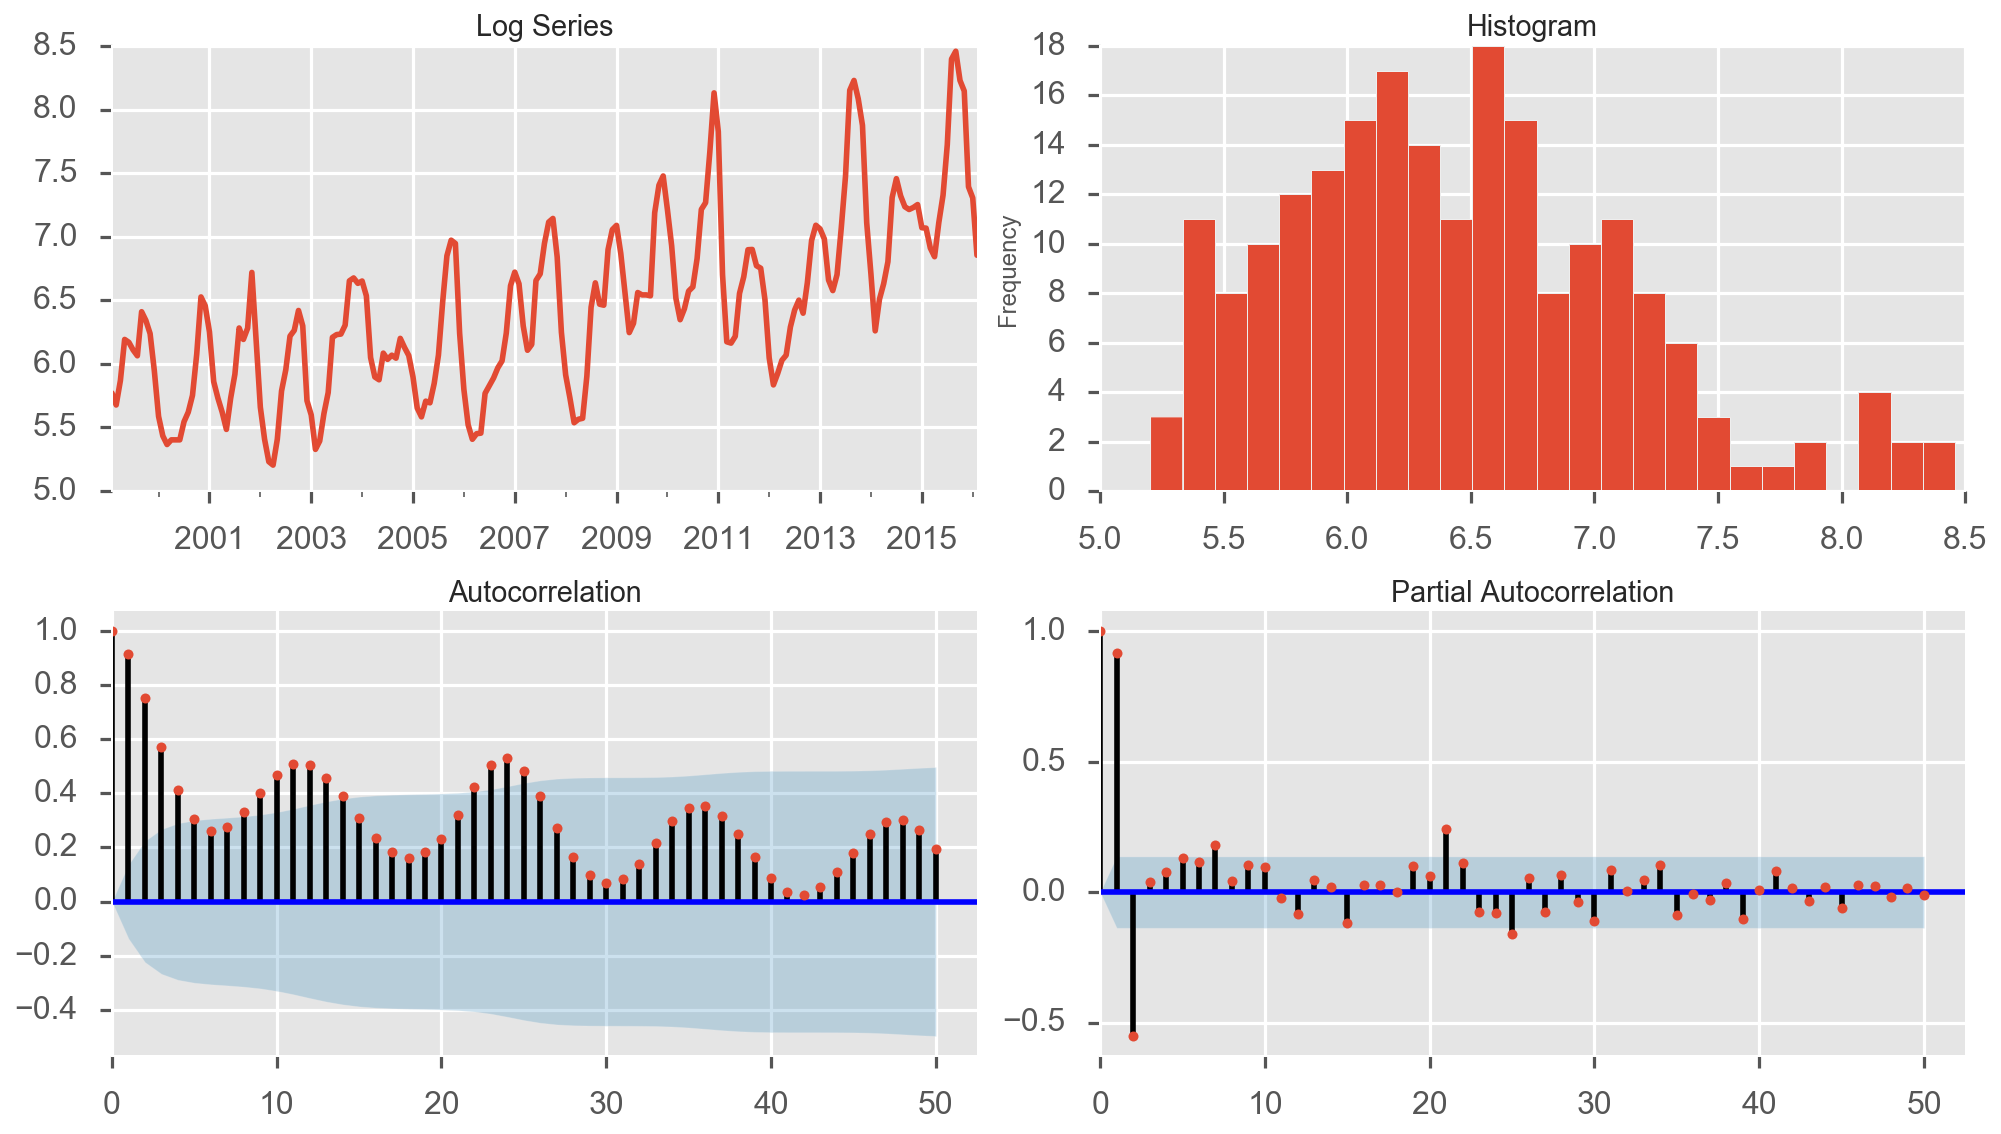
So, I am looking my raw time series dataset, which is non stationary. I initially used the log transformation to stationarize the dataset. The plot the graph(down below). It is obvious that there is still a seasonal component to the data from the ACF plot.

Log Transformation

I then tried to use differencing to remove the seasonal component. That resulted in me getting the plot below

Differenced Log series

I feel stuck here. How do I proceed from here ? How do I interpret the seasonality of the Log differenced plot and model the data ?

$\endgroup$
2
  • $\begingroup$ There is a number of options. You have to de-seasonalize. This could be done by fitting a dummy for each month (easy, but may be theoretically less appealing), you could fit a Fourier series to capture the cyclical nature (less straightforward how to choose the number of components to fit, but more appealing for cyclical data), or you could go with another way to extract a cyclical function $f(t)$ and then transform your observations $y_t$ into ${y}_t^{\ast} = y_t - f(t)$ $\endgroup$
    – Jeremias K
    Commented Feb 22, 2017 at 16:22
  • $\begingroup$ @JeremiasK, a small note: there is a difference between seasonal and cyclical patterns: seasons are always of the same lenght, cycles are not. When talking about Fourier terms and seasonal dummies, seasonal (rather than cyclical) is the relevant term. $\endgroup$ Commented Feb 22, 2017 at 19:07

2 Answers 2

6
$\begingroup$

As you've rightly pointed out, the ACF in the first image clearly shows an annual seasonal trend wrt. peaks at yearly lag at about 12, 24, etc. The log-transformed series represents the series scaled to a logarithmic scale. This represents the size of the seasonal fluctuations and random fluctuations in the log-transformed time series which seem to be roughly constant over the yearly seasonal fluctuation and does not seem to depend on the level of the time series.

Since, we observe annual seasonality, the most appropriate $d$-th order differencing for this data set seems to be the $12$-th order differencing. Then, the log-transformed series is expected to represent a randomly fluctuated log-series. The elimination of the annual cycle seems about right.

$\endgroup$
4
  • $\begingroup$ Would you agree then that the 2nd set of 4 charts above reveal a series that has been both over-differenced (one shouldn't difference it at lag 1) and under-differenced (one still needs to difference it at lag 12)? $\endgroup$
    – rolando2
    Commented Feb 22, 2017 at 20:02
  • $\begingroup$ @rolando2 Yes, I'd believe so. $\endgroup$
    – dangiankit
    Commented Feb 22, 2017 at 22:00
  • $\begingroup$ Regarding terminology: order of differencing is typically used to refer to how many times differencing is done ($\Delta^h$) rather than at which lag ($x_t-x_{t-h}$). @rolando2, I wonder if the ACF and PACF plots could be said to indicate seasonal integration. There is a clear seasonal pattern, but whether the seasonal AR coefficient is 1.0 (integrated) or 0.8 or 0.6 (both stationary) is not obvious, or is it? $\endgroup$ Commented Feb 23, 2017 at 8:11
  • $\begingroup$ @rolando2 Are you saying that the series needs to be differenced on lag 12 ? $\endgroup$
    – Ram
    Commented Feb 23, 2017 at 10:47
5
$\begingroup$

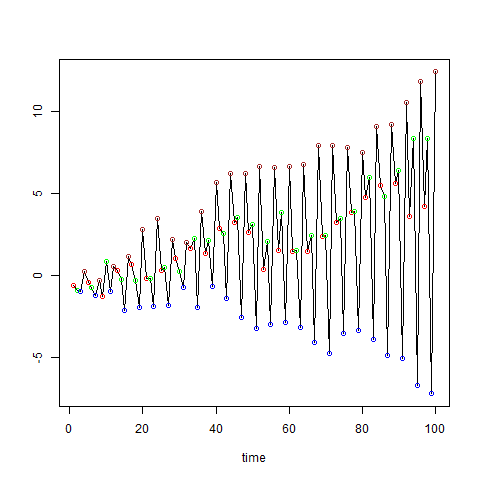
Seasonal differencing is relevant when the time series is seasonally integrated. Consider the simplest form of seasonal integration -- a SARIMA$(0,0,0)\times(0,1,0)_h$ model with a seasonal period $h$. The original time series under this model is made up of $h$ random walks that alternate every season. I.e. each season has its own random walk, and the random walks of the different seasons are unrelated.

Here is an example with $h=4$ (circles of different colours are used to distinguish between the seasons):
enter image description here

That may or may not be sensible in applications as you would not always expect the difference between two consecutive time points to have values that diverge from each other (which happens under seasonal integration).

A sign that a series is not seasonally integrated is significant PACF at seasonal lags after seasonal differencing. For a seasonally non-integrated series, taking seasonal differences does not solve a problem but rather creates one (the problem of overdifferencing). The presence of seasonal integration can be formally tested by OCSB or Canova-Hansen tests.

If the series is seasonally non-integrated, you may consider a SARIMA$(p,d,q)\times(P,0,Q)_h$ model or using dummy variables or Fourier terms.

$\endgroup$

Your Answer

By clicking “Post Your Answer”, you agree to our terms of service and acknowledge you have read our privacy policy.

Not the answer you're looking for? Browse other questions tagged or ask your own question.