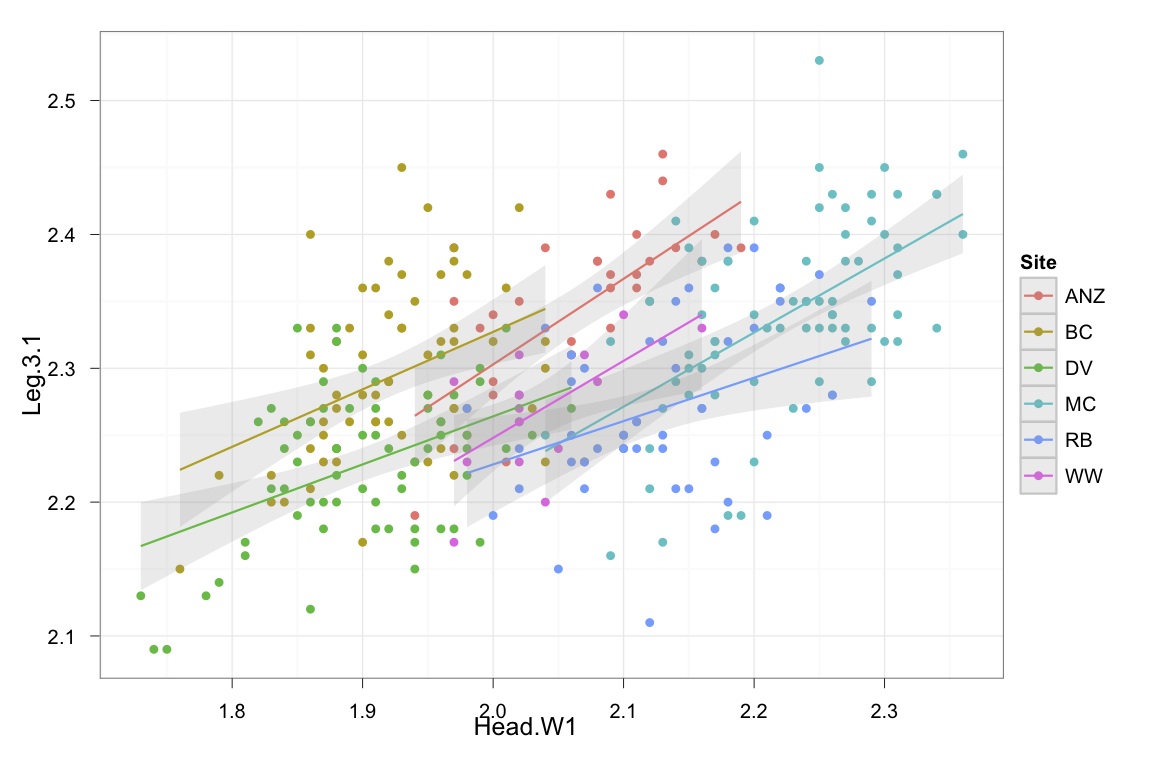
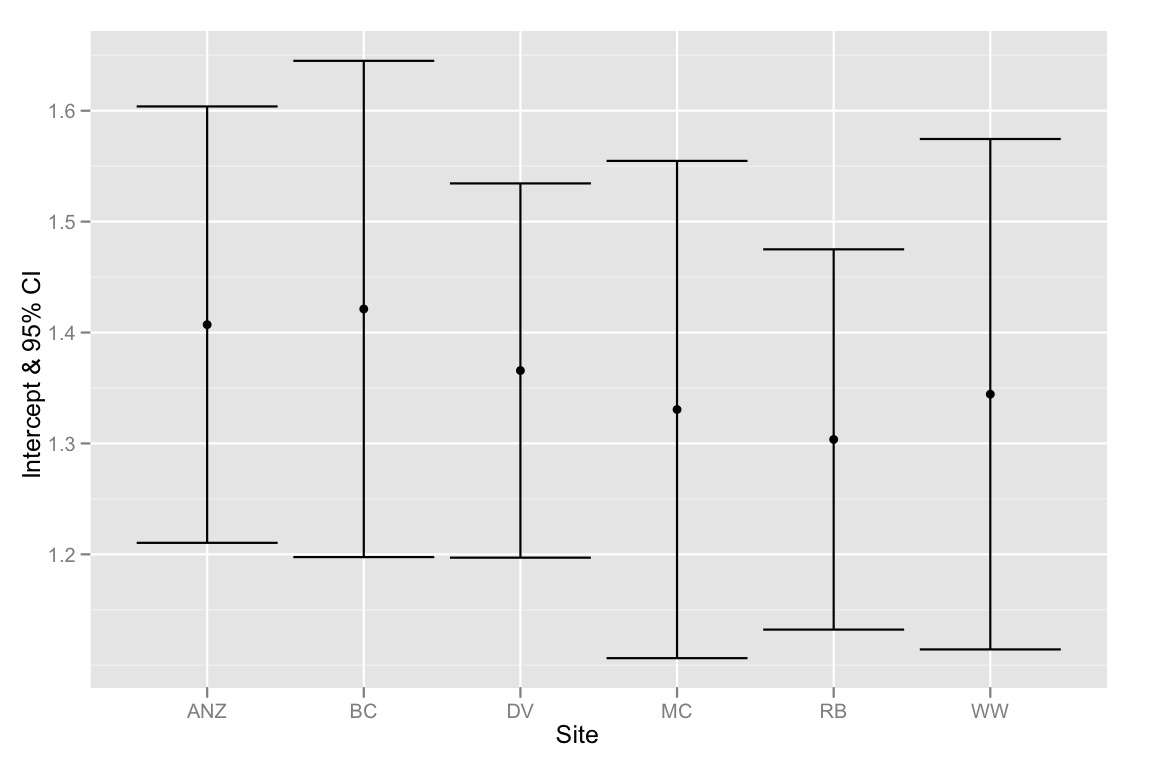
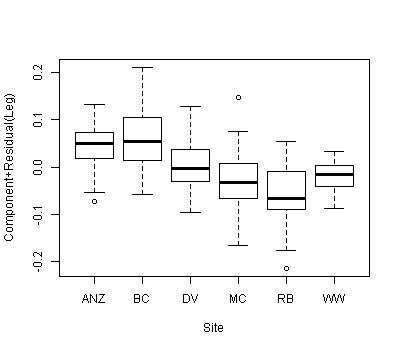
We have a data set with two covariates and a categorical grouping variable and want to know if there are significant differences between the slope or intercept among the covariates associated with the different grouping variables. We've used anova() and lm() to compare the fits of three different models: 1) with a single slope and intercept, 2) with different intercepts for each group, and 3) with a slope and an intercept for each group. According to the anova() general linear test, the second model is the most appropriate of the three, there is a significant improvement to the model by including a separate intercept for each group. However, when we look at the 95% confidence intervals for these intercepts -- they all overlap, suggesting there aren't significant differences between the intercepts. How can these two results be reconciled? We thought another way of interpreting the results of the model-selection method was that there has to be at least one significant difference among the intercepts... but perhaps this is not correct?
Below is the R code to replicate this analysis. We've used the dput() function so you can work with exactly the same data we're grappling with.
# Begin R Script
# > dput(data)
structure(list(Head = c(1.92, 1.93, 1.79, 1.94, 1.91, 1.88, 1.91,
1.9, 1.97, 1.97, 1.95, 1.93, 1.95, 2, 1.87, 1.88, 1.97, 1.88,
1.89, 1.86, 1.86, 1.97, 2.02, 2.04, 1.9, 1.83, 1.95, 1.87, 1.93,
1.94, 1.91, 1.96, 1.89, 1.87, 1.95, 1.86, 2.03, 1.88, 1.98, 1.97,
1.86, 2.04, 1.86, 1.92, 1.98, 1.86, 1.83, 1.93, 1.9, 1.97, 1.92,
2.04, 1.92, 1.9, 1.93, 1.96, 1.91, 2.01, 1.97, 1.96, 1.76, 1.84,
1.92, 1.96, 1.87, 2.1, 2.17, 2.1, 2.11, 2.17, 2.12, 2.06, 2.06,
2.1, 2.05, 2.07, 2.2, 2.14, 2.02, 2.08, 2.16, 2.11, 2.29, 2.08,
2.04, 2.12, 2.02, 2.22, 2.22, 2.2, 2.26, 2.15, 2, 2.24, 2.18,
2.07, 2.06, 2.18, 2.14, 2.13, 2.2, 2.1, 2.13, 2.15, 2.25, 2.14,
2.07, 1.98, 2.16, 2.11, 2.21, 2.18, 2.13, 2.06, 2.21, 2.08, 1.88,
1.81, 1.87, 1.88, 1.87, 1.79, 1.99, 1.87, 1.95, 1.91, 1.99, 1.85,
2.03, 1.88, 1.88, 1.87, 1.85, 1.94, 1.98, 2.01, 1.82, 1.85, 1.75,
1.95, 1.92, 1.91, 1.98, 1.92, 1.96, 1.9, 1.86, 1.97, 2.06, 1.86,
1.91, 2.01, 1.73, 1.97, 1.94, 1.81, 1.86, 1.99, 1.96, 1.94, 1.85,
1.91, 1.96, 1.9, 1.98, 1.89, 1.88, 1.95, 1.9, 1.94, NA, 1.84,
1.83, 1.84, 1.96, 1.74, 1.91, 1.84, 1.88, 1.83, 1.93, 1.78, 1.88,
1.93, 2.15, 2.16, 2.23, 2.09, 2.36, 2.31, 2.25, 2.29, 2.3, 2.04,
2.22, 2.19, 2.25, 2.31, 2.3, 2.28, 2.25, 2.15, 2.29, 2.24, 2.34,
2.2, 2.24, 2.17, 2.26, 2.18, 2.17, 2.34, 2.23, 2.36, 2.31, 2.13,
2.2, 2.27, 2.27, 2.2, 2.34, 2.12, 2.26, 2.18, 2.31, 2.24, 2.26,
2.15, 2.29, 2.14, 2.25, 2.31, 2.13, 2.09, 2.24, 2.26, 2.26, 2.21,
2.25, 2.29, 2.15, 2.2, 2.18, 2.16, 2.14, 2.26, 2.22, 2.12, 2.12,
2.16, 2.27, 2.17, 2.27, 2.17, 2.3, 2.25, 2.17, 2.27, 2.06, 2.13,
2.11, 2.11, 1.97, 2.09, 2.06, 2.11, 2.09, 2.08, 2.17, 2.12, 2.13,
1.99, 2.08, 2.01, 1.97, 1.97, 2.09, 1.94, 2.06, 2.09, 2.04, 2,
2.14, 2.07, 1.98, 2, 2.19, 2.12, 2.06, 2, 2.02, 2.16, 2.1, 1.97,
1.97, 2.1, 2.02, 1.99, 2.13, 2.05, 2.05, 2.16, 2.02, 2.02, 2.08,
1.98, 2.04, 2.02, 2.07, 2.02, 2.02, 2.02), Site = structure(c(2L,
2L, 2L, 2L, 2L, 2L, 2L, 2L, 2L, 2L, 2L, 2L, 2L, 2L, 2L, 2L, 2L,
2L, 2L, 2L, 2L, 2L, 2L, 2L, 2L, 2L, 2L, 2L, 2L, 2L, 2L, 2L, 2L,
2L, 2L, 2L, 2L, 2L, 2L, 2L, 2L, 2L, 2L, 2L, 2L, 2L, 2L, 2L, 2L,
2L, 2L, 2L, 2L, 2L, 2L, 2L, 2L, 2L, 2L, 2L, 2L, 2L, 2L, 2L, 2L,
5L, 5L, 5L, 5L, 5L, 5L, 5L, 5L, 5L, 5L, 5L, 5L, 5L, 5L, 5L, 5L,
5L, 5L, 5L, 5L, 5L, 5L, 5L, 5L, 5L, 5L, 5L, 5L, 5L, 5L, 5L, 5L,
5L, 5L, 5L, 5L, 5L, 5L, 5L, 5L, 5L, 5L, 5L, 5L, 5L, 5L, 5L, 5L,
5L, 5L, 5L, 3L, 3L, 3L, 3L, 3L, 3L, 3L, 3L, 3L, 3L, 3L, 3L, 3L,
3L, 3L, 3L, 3L, 3L, 3L, 3L, 3L, 3L, 3L, 3L, 3L, 3L, 3L, 3L, 3L,
3L, 3L, 3L, 3L, 3L, 3L, 3L, 3L, 3L, 3L, 3L, 3L, 3L, 3L, 3L, 3L,
3L, 3L, 3L, 3L, 3L, 3L, 3L, 3L, 3L, 3L, 3L, 3L, 3L, 3L, 3L, 3L,
3L, 3L, 3L, 3L, 3L, 3L, 3L, 4L, 4L, 4L, 4L, 4L, 4L, 4L, 4L, 4L,
4L, 4L, 4L, 4L, 4L, 4L, 4L, 4L, 4L, 4L, 4L, 4L, 4L, 4L, 4L, 4L,
4L, 4L, 4L, 4L, 4L, 4L, 4L, 4L, 4L, 4L, 4L, 4L, 4L, 4L, 4L, 4L,
4L, 4L, 4L, 4L, 4L, 4L, 4L, 4L, 4L, 4L, 4L, 4L, 4L, 4L, 4L, 4L,
4L, 4L, 4L, 4L, 4L, 4L, 4L, 4L, 4L, 4L, 4L, 4L, 4L, 4L, 4L, 4L,
4L, 1L, 1L, 1L, 1L, 1L, 1L, 1L, 1L, 1L, 1L, 1L, 1L, 1L, 1L, 1L,
1L, 1L, 1L, 1L, 1L, 1L, 1L, 1L, 1L, 1L, 1L, 1L, 1L, 1L, 1L, 1L,
1L, 1L, 1L, 6L, 6L, 6L, 6L, 6L, 6L, 6L, 6L, 6L, 6L, 6L, 6L, 6L,
6L, 6L, 6L, 6L, 6L, 6L, 6L), .Label = c("ANZ", "BC", "DV", "MC",
"RB", "WW"), class = "factor"), Leg = c(2.38, 2.45, 2.22, 2.23,
2.26, 2.32, 2.28, 2.17, 2.39, 2.27, 2.42, 2.33, 2.31, 2.32, 2.25,
2.27, 2.38, 2.28, 2.33, 2.24, 2.21, 2.22, 2.42, 2.23, 2.36, 2.2,
2.28, 2.23, 2.33, 2.35, 2.36, 2.26, 2.26, 2.3, 2.23, 2.31, 2.27,
2.23, 2.37, 2.27, 2.26, 2.3, 2.33, 2.34, 2.27, 2.4, 2.22, 2.25,
2.28, 2.33, 2.26, 2.32, 2.29, 2.31, 2.37, 2.24, 2.26, 2.36, 2.32,
2.32, 2.15, 2.2, 2.29, 2.37, 2.26, 2.24, 2.23, 2.24, 2.26, 2.18,
2.11, 2.23, 2.31, 2.25, 2.15, 2.3, 2.33, 2.35, 2.21, 2.36, 2.27,
2.24, 2.35, 2.24, 2.33, 2.32, 2.24, 2.35, 2.36, 2.39, 2.28, 2.36,
2.19, 2.27, 2.39, 2.23, 2.29, 2.32, 2.3, 2.32, NA, 2.25, 2.24,
2.21, 2.37, 2.21, 2.21, 2.27, 2.27, 2.26, 2.19, 2.2, 2.25, 2.25,
2.25, NA, 2.24, 2.17, 2.2, 2.2, 2.18, 2.14, 2.17, 2.27, 2.28,
2.27, 2.29, 2.23, 2.25, 2.33, 2.22, 2.29, 2.19, 2.15, 2.24, 2.24,
2.26, 2.25, 2.09, 2.27, 2.18, 2.2, 2.25, 2.24, 2.18, 2.3, 2.26,
2.18, 2.27, 2.12, 2.18, 2.33, 2.13, 2.28, 2.23, 2.16, 2.2, 2.3,
2.31, 2.18, 2.33, 2.29, 2.26, 2.21, 2.22, 2.27, 2.32, 2.24, 2.25,
2.17, 2.2, 2.26, 2.27, 2.24, 2.25, 2.09, 2.25, 2.21, 2.24, 2.21,
2.22, 2.13, 2.24, 2.21, 2.3, 2.34, 2.35, 2.32, 2.46, 2.43, 2.42,
2.41, 2.32, 2.25, 2.33, 2.19, 2.45, 2.32, 2.4, 2.38, 2.35, 2.39,
2.29, 2.35, 2.43, 2.29, 2.33, 2.31, 2.28, 2.38, 2.32, 2.43, 2.27,
2.4, 2.37, 2.27, 2.41, 2.32, 2.38, 2.23, 2.33, 2.21, 2.34, 2.19,
2.34, 2.35, 2.35, 2.31, 2.33, 2.41, 2.53, 2.39, 2.17, 2.16, 2.38,
2.34, 2.33, 2.33, 2.29, 2.43, 2.28, 2.34, 2.38, 2.3, 2.29, 2.43,
2.36, 2.24, 2.35, 2.38, 2.4, 2.36, 2.42, 2.28, 2.45, 2.33, 2.32,
2.33, 2.31, 2.44, 2.37, 2.4, 2.35, 2.33, 2.31, 2.36, 2.43, 2.38,
2.4, 2.38, 2.46, 2.33, 2.38, 2.23, 2.24, 2.39, 2.36, 2.19, 2.32,
2.37, 2.39, 2.34, 2.39, 2.23, 2.25, 2.29, 2.39, 2.35, NA, 2.28,
2.35, 2.38, 2.34, 2.17, 2.29, NA, 2.26, NA, NA, NA, 2.24, 2.33,
2.23, 2.28, 2.29, 2.23, 2.2, 2.27, 2.31, 2.31, 2.26, 2.28)), .Names = c("Head",
"Site", "Leg"), class = "data.frame", row.names = c(NA, -312L
))

# plot graph
library(ggplot2)

qplot(Head, Leg,
    color=Site,
    data=data) +
        stat_smooth(method="lm", alpha=0.2) +
        theme_bw()

# create linear models
lm.1 <- lm(Leg ~ Head, data)
lm.2 <- lm(Leg ~ Head + Site, data)
lm.3 <- lm(Leg ~ Head*Site, data)

# evaluate linear models
anova(lm.1, lm.2, lm.3)
anova(lm.1, lm.2)

# > anova(lm.1, lm.2)
# Analysis of Variance Table
# Model 1: Leg.3.1 ~ Head.W1
# Model 2: Leg.3.1 ~ Head.W1 + Site
  # Res.Df     RSS Df Sum of Sq     F    Pr(>F)
# 1    302 1.25589
# 2    297 0.91332  5   0.34257 22.28 < 2.2e-16 ***


# examining the multiple-intercepts model (lm.2)
summary(lm.2)
coef(lm.2)
confint(lm.2)

# extracting the intercepts
intercepts <- coef(lm.2)[c(1, 3:7)]
intercepts.1 <- intercepts[1]
intercepts <- intercepts.1 + intercepts
intercepts[1] <- intercepts.1
intercepts

# extracting the confidence intervals
ci <- confint(lm.2)[c(1, 3:7),]
ci[2:6,] <- ci[2:6,] + confint(lm.2)[1,]
ci[,1]

# putting everything together in a dataframe
labels <- c("ANZ", "BC", "DV", "MC", "RB", "WW")
ci.dataframe <- data.frame(Site=labels, Intercept=intercepts, CI.low = ci[,1], CI.high = ci[,2])
ci.dataframe

# plotting intercepts and 95% CI
qplot(Site, Intercept, geom=c("point", "errorbar"), ymin=CI.low, ymax=CI.high, data=ci.dataframe, ylab="Intercept & 95% CI")

Just to summarize -- the problem is that the 95% CIs for the intercepts all overlap, but the model selection method suggests that the best model is one that fits different intercepts. So I'm inclined to think either our model selection method is flawed or the 95% CIs for the intercept estimates were calculated incorrectly. Any thoughts would be greatly appreciated!


