0
$\begingroup$

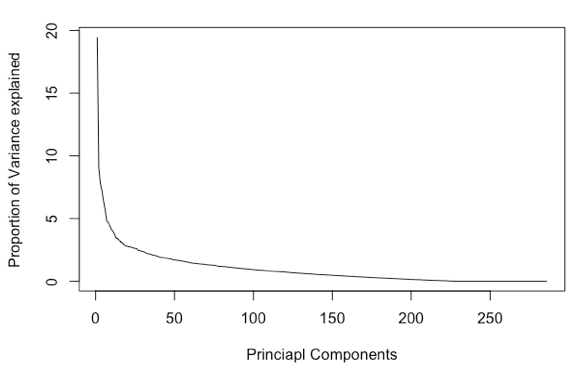
I am running PCA on a dataset with dimensions 1460(n) * 307(p). Upon running PCA, I obtain the below plot of variance explained and the number of components. I am trying to estimate the number of PCs to select for my training dataset.

Based on the plot below, It appears that around 75% of the variance is explained/captured by 50 PCs. So, selecting 50 PCs is a reasonable estimate.

How would you interpret the below plot and estimate # of PCs to select?

Thanks!

enter image description here

$\endgroup$
4
  • $\begingroup$ support.minitab.com/en-us/minitab/17/topic-library/… $\endgroup$
    – SmallChess
    Commented Mar 22, 2017 at 3:11
  • $\begingroup$ You choose your desired percentage (80%, 90%). You use it to select your components. $\endgroup$
    – SmallChess
    Commented Mar 22, 2017 at 3:12
  • $\begingroup$ @Student T yeah - the scree plot shows a steep curve until like ~20 PCs and then it's horizontal line from then on. $\endgroup$
    – kms
    Commented Mar 22, 2017 at 3:15
  • $\begingroup$ Answers in this post go into detail on methods for appropriately selecting the number of components. The Valle paper referred to is a very good introduction to this topic: stats.stackexchange.com/questions/100143/… $\endgroup$ Commented Mar 22, 2017 at 6:42

0

Your Answer

By clicking “Post Your Answer”, you agree to our terms of service and acknowledge you have read our privacy policy.

Browse other questions tagged or ask your own question.