22
$\begingroup$

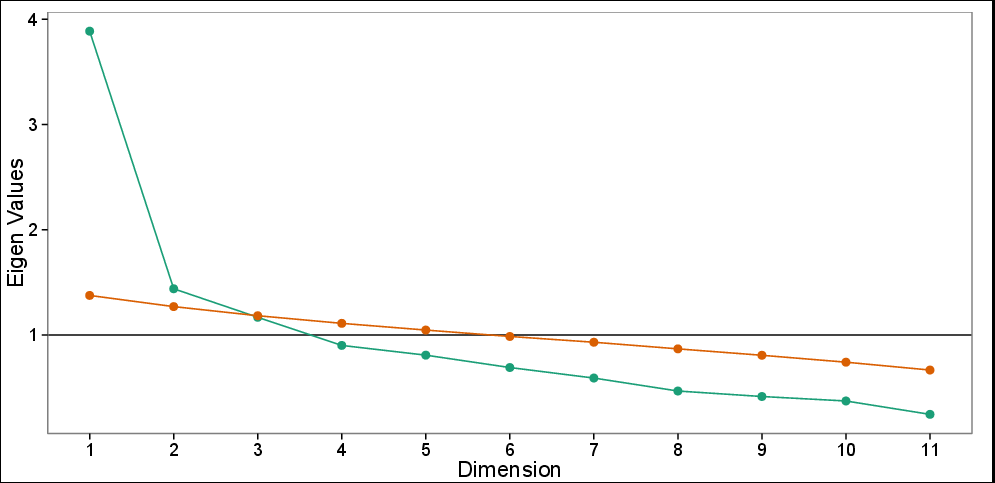
I have a dataset with 11 variables and PCA (orthogonal) was done to reduce the data. Deciding on the number of components to keep it was evident for me from my knowledge about the subject and the scree plot (see below) that two principal components (PCs) were enough to explain the data and the remaining components were only less informative.
enter image description here
Scree plot with parallel analysis: observed eigenvalues (green) and simulated eigenvalues based on 100 simulations (red). Scree plot suggests 3 PCs, whereas parallel test suggests only the first two PCs.
enter image description here

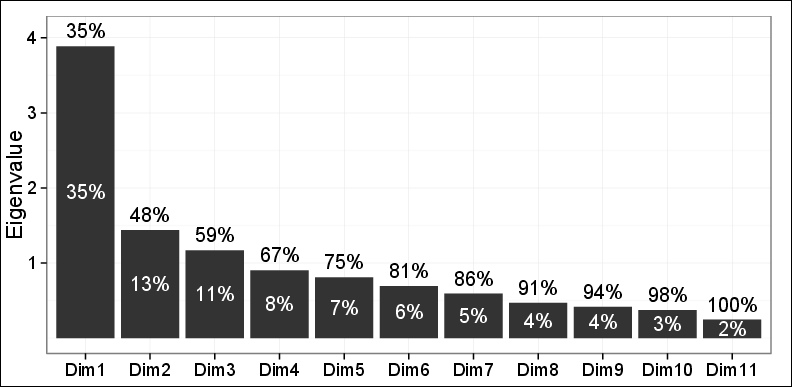
As you can see only 48% of the variance could be captured by the first two PCs.

Plotting observations on the first plane made by the first 2 PCs revealed three different clusters using hierarchical agglomerative clustering (HAC) and K-means clustering. These 3 clusters turned out to be very relevant to the problem in question and were consistent with other findings as well. So except the fact that only 48% of variance was captured everything else was tremendously fine.

One of my two reviewers said: one cannot rely much on these findings as only 48% of variance could be explained and it is less than required.

Question
Is there any required value of how much variance should be captured by PCA to be valid? Is it not dependent on the domain knowledge and methodology in use? Can anybody judge on the merit of the whole analysis just based on the mere value of the explained variance?

Notes

  • Data are 11 variables of genes measured by a very sensitive methodology in molecular biology called Real-Time Quantitative Polymerase Chain Reaction (RT-qPCR).
  • Analyses were done using R.
  • Answers from data analysts based on their personal experience working on real-life problems in the fields of microarray analysis, chemometrics, spectometric analyses or alike are much appreciated.
  • Please consider supporting you answer with references as much as possible.
$\endgroup$
4
  • $\begingroup$ The distribution of eigenvalues is pretty important for Random Matrix Theory. The Marcenko-Pastur distribution is sometimes used for similar applications. $\endgroup$
    – John
    Commented Jan 14, 2015 at 20:38
  • $\begingroup$ What does the green and what do the orange/brownish lines show? There is only in axis. $\endgroup$
    – usεr11852
    Commented Jan 14, 2015 at 23:20
  • $\begingroup$ @usεr11852, please see the updated caption. $\endgroup$
    – doctorate
    Commented Jan 15, 2015 at 13:07
  • $\begingroup$ You should take into account as many Principal Components that have eigenvalues greater than 1. I think in your case the number is 4. $\endgroup$
    – Irina
    Commented Dec 5, 2020 at 0:12

1 Answer 1

13
$\begingroup$

Regarding your particular questions:

Is there any required value of how much variance should be captured by PCA to be valid?

No, there is not (to my best of knowledge). I firmly believe that there is no single value you can use; no magic threshold of the captured variance percentage. The Cangelosi and Goriely's article : Component retention in principal component analysis with application to cDNA microarray data gives a rather nice overview of half a dozen standard rules of thumb to detect the number of components in a study. (Scree plot, Proportion of total variance explained, Average eigenvalue rule, Log-eigenvalue diagram, etc.) As rules of thumb I would not strongly rely on any of them.

Is it not dependent on the domain knowledge and methodology in use?

Ideally it should be dependent but you need to be careful how you word it and what you mean.

For example: In Acoustics there is the notion of Just Noticeable Difference (JND). Assume you are analyzing an acoustics sample and a particular PC has physical-scale variation well below that JND threshold. Nobody can readily argue that for an Acoustics application you should have included that PC. You would be analyzing inaudible noise. There might be some reasons to include this PC but these reasons need to be presented not the other way around. Are they notions similar to JND for RT-qPCR analysis?

Similarly, if a component looks like 9th order Legendre polynomial and you have strong evidence that your sample consists of single Gaussian bumps you have good reasons to believe you are again modeling irrelevant variation. What are these orthogonal modes of variation showing? What is "wrong" with the 3rd PC in your case for example?

The fact that you say "These 3 clusters turned out to be very relevant to the problem in question" is not really a strong argument. You might simple data dredge (which is a bad thing). There are other techniques, eg. Isomaps and locally-linear embedding, which are pretty cool too, why not use those? Why did you choose PCA specifically?

The consistency of your findings with other findings is more important, especially if these finding are considered well-established. Dig deeper on this. Try to see if your results agree with PCA findings from other studies.

Can anybody judge on the merit of the whole analysis just based on the mere value of the explained variance?

In general one should not do that. Do not think that your reviewer is a bastard or anything like that though; 48% is indeed a small percentage to retain without presenting reasonable justifications.

$\endgroup$
5
  • $\begingroup$ Thank you for your answer. There is nothing too special about RT-qPCR as with JND. In fact, RT-qPCR is only the technique by which we measure the gene variables themselves. Most probably you meant the PCs which are the new variables made of the linear combination of all 11. Given other descriptive variables, the first 2 PCs turned out to be related to cells of the immune response, whereas 3rd PC not. Otherwise there is nothing wrong the 3rd PC. $\endgroup$
    – doctorate
    Commented Jan 15, 2015 at 13:18
  • $\begingroup$ I will have a look at data dredge techniques and learn more about them. But do you know by chance whether this has been implemented by any R-package(s)? $\endgroup$
    – doctorate
    Commented Jan 15, 2015 at 13:22
  • 1
    $\begingroup$ @doctorate: The whole idea is to avoid data dredging. I am sorry but I do not know any packages that explicitly test for it. $\endgroup$
    – usεr11852
    Commented Jan 16, 2015 at 0:23
  • 1
    $\begingroup$ +1, but your sentence about data dredging ("you might simple data dredge") is not very clear and perhaps that is why @doctorate was confused. In fact, I find that whole paragraph not very clear: what do Isomap and LLE have to do with data dredging? is data dredging good or bad? wiki article you linked to starts with describing it as smth good. Perhaps you could edit to be a bit more explicit in that paragraph? $\endgroup$
    – amoeba
    Commented Jan 21, 2015 at 18:57
  • $\begingroup$ LOL "Do not think that your reviewer is a bastard or anything like that though" $\endgroup$ Commented Mar 9, 2021 at 3:20

Your Answer

By clicking “Post Your Answer”, you agree to our terms of service and acknowledge you have read our privacy policy.

Not the answer you're looking for? Browse other questions tagged or ask your own question.