3
$\begingroup$

I have the following multiple linear regression model:

Call:
lm(formula = Y ~ X1 + X2 + X2 + X3 + X4 + X5 + X6 + X7, 
    data = my.model, na.action = na.omit)

Residuals:
    Min      1Q  Median      3Q     Max 
-43.836  -1.507   0.010   1.485  46.231 

Coefficients:
               Estimate Std. Error t value Pr(>|t|)    
(Intercept)  -0.0244927  0.0245157  -0.999    0.318    
X1           -0.3484619  0.0134383 -25.931   <2e-16 ***
X2            0.1195273  0.0106940  11.177   <2e-16 ***
X3            0.1224587  0.0108849  11.250   <2e-16 ***
X4           -0.0010173  0.0028247  -0.360    0.719    
X5            0.5496942  0.0156319  35.165   <2e-16 ***
X6           -0.2287941  0.0145018 -15.777   <2e-16 ***
X7           -0.2315801  0.0146361 -15.823   <2e-16 ***
X8            0.0005465  0.0003595   1.520    0.128    
---
Signif. codes:  0 '***' 0.001 '**' 0.01 '*' 0.05 '.' 0.1 ' ' 1 

Residual standard error: 2.936 on 35849 degrees of freedom
  (12534 observations deleted due to missingness)
Multiple R-squared: 0.05968,    Adjusted R-squared: 0.05947 
F-statistic: 284.4 on 8 and 35849 DF,  p-value: < 2.2e-16 

The model is affected by multicollinearity but my question is about the forecast, so this shouldn't be an issue.

I checked the absolute values of my model forecast and compared against the actual Y absolute values. The average of the absolute predicted values is significantly lower than the absolute observed values mean:

> lm1.predict = predict(lm1, mydata)
> mean(abs(lm1.predict))
[1] 0.3294776
> mean(abs(mydata$Y))
[1] 1.206954

Does this mean that the linear regression variables I am using tend to underestimate the outcomes? Can any other conclusion be derived from this simple comparison?

EDIT

Another way to look at this is to calculate the absolute difference between each observation and the relative outcome:

> mean(abs(mydata$Y - lm1.predict))
[1] 1.208378

These are the diagnostic from the regression:
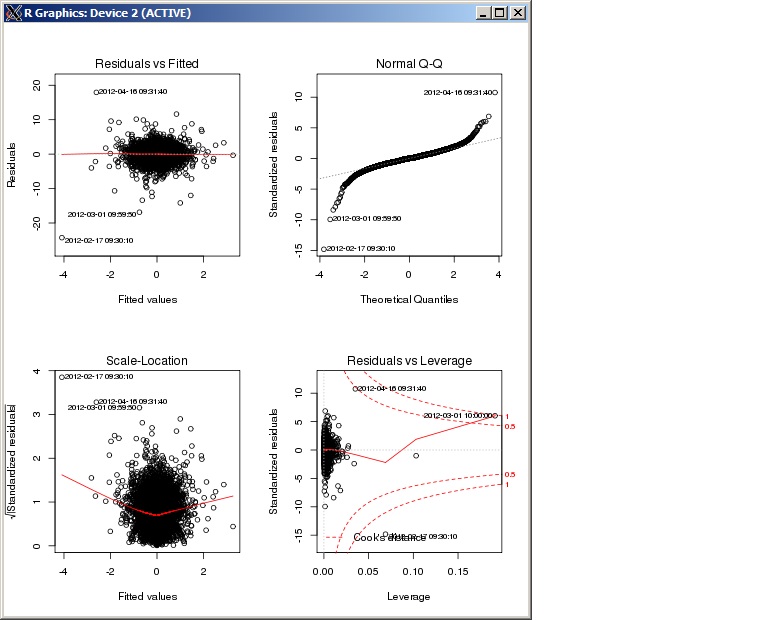
enter image description here

$\endgroup$
5
  • $\begingroup$ You have some outlying residuals. What do your regression diagnostics say about their leverage and how many of them there are? What do the diagnostic plots suggest about goodness of fit? $\endgroup$
    – whuber
    Commented May 3, 2012 at 20:12
  • 6
    $\begingroup$ 1) Since you're not estimating the absolute values in your model, why are you using absolute values in the check? 2) If the mean of $Y$ is close to 0 (relative to the std. dev. of $Y$), all this comparison will tell you is that the predictions have less dispersion than $Y$, which is a consequence of the estimation procedure and not worth worrying about. $\endgroup$
    – jbowman
    Commented May 3, 2012 at 20:29
  • $\begingroup$ @jbowman I'm using absolute values because while I was reading through the predictions one at the time I noticed that the relative outcomes were all lower by substantial margin. I added the average of the absolute difference between each prediction and relative outcome to the question. $\endgroup$ Commented May 3, 2012 at 21:14
  • $\begingroup$ @whuber I added the diagnostics. If I'm not mistaken their impact shouldn't be very large given the number of data points. $\endgroup$ Commented May 3, 2012 at 21:26
  • 2
    $\begingroup$ The most revealing part is that the fitted values have a mean near 0, showing that @jbowman's surmise is correct. $\endgroup$
    – whuber
    Commented May 4, 2012 at 13:56

1 Answer 1

8
$\begingroup$

The variance of predictions is always going to be less than the variance of the observations. The predictions are estimates of the means of the distributions conditional on the predictors. So, assuming the mean of the data is not too far from zero, you are comparing the dispersion of the means with the dispersion of the observations.

$\endgroup$
12
  • $\begingroup$ Of course! The variance of the regression line is always going to be smaller than the variance of the outcomes. $\endgroup$ Commented May 3, 2012 at 23:36
  • $\begingroup$ Rob, how did you get from mean(abs(mydata$Y)) to the "variance of the observations"? There seems to be a missing step in your reasoning. I think the edited information plays a crucial role here in revealing that the mean observation is close to zero. $\endgroup$
    – whuber
    Commented May 4, 2012 at 13:58
  • $\begingroup$ @whuber By calculating the mean of the absolute values I'm effectively looking at a proxy for variance. mean(abs(values)) simply give us a measure of data dispersion. I'm not clear why you're referring to the simple mean of mydata$Y. I don't see it reported in the question. $\endgroup$ Commented May 4, 2012 at 14:44
  • 1
    $\begingroup$ I'm hung up on this phrase, Robert: "The average of the absolute predicted values is significantly lower than the absolute observed values mean". To see why this is puzzling, consider what would happen if, say, you were to add $100$ to every y-value. The fit would be unchanged--it would merely increase the intercept by $100$. But the mean absolute value would increase by almost $100$. Thus you seem to be making a comparison that reveals nothing about the quality of the fit. I think you get it right in the edit where you use mean(abs(mydata$Y - lm1.predict)) instead. $\endgroup$
    – whuber
    Commented May 4, 2012 at 15:24
  • 1
    $\begingroup$ Alas, that seems not to be the case, @Rob. When the means are zero, then yes, the mean absolute value is a measure of dispersion. But consider what happens when the shift is large enough to make all values (actual and predicted) positive. Now the mean absolute values coincide with the means, giving us no information about the dispersions (absent special parametric assumptions). Notice that no analog of the decomposition of mean square into squared mean plus variance exists for the $L^1$ (or other $L^p$) measures of dispersion. $\endgroup$
    – whuber
    Commented May 7, 2012 at 14:57

Your Answer

By clicking “Post Your Answer”, you agree to our terms of service and acknowledge you have read our privacy policy.

Not the answer you're looking for? Browse other questions tagged or ask your own question.