I have the following multiple linear regression model:
Call:
lm(formula = Y ~ X1 + X2 + X2 + X3 + X4 + X5 + X6 + X7,
    data = my.model, na.action = na.omit)

Residuals:
    Min      1Q  Median      3Q     Max
-43.836  -1.507   0.010   1.485  46.231

Coefficients:
               Estimate Std. Error t value Pr(>|t|)
(Intercept)  -0.0244927  0.0245157  -0.999    0.318
X1           -0.3484619  0.0134383 -25.931   <2e-16 ***
X2            0.1195273  0.0106940  11.177   <2e-16 ***
X3            0.1224587  0.0108849  11.250   <2e-16 ***
X4           -0.0010173  0.0028247  -0.360    0.719
X5            0.5496942  0.0156319  35.165   <2e-16 ***
X6           -0.2287941  0.0145018 -15.777   <2e-16 ***
X7           -0.2315801  0.0146361 -15.823   <2e-16 ***
X8            0.0005465  0.0003595   1.520    0.128
---
Signif. codes:  0 '***' 0.001 '**' 0.01 '*' 0.05 '.' 0.1 ' ' 1

Residual standard error: 2.936 on 35849 degrees of freedom
  (12534 observations deleted due to missingness)
Multiple R-squared: 0.05968,    Adjusted R-squared: 0.05947
F-statistic: 284.4 on 8 and 35849 DF,  p-value: < 2.2e-16
The model is affected by multicollinearity but my question is about the forecast, so this shouldn't be an issue.
I checked the absolute values of my model forecast and compared against the actual Y absolute values. The average of the absolute predicted values is significantly lower than the absolute observed values mean:
> lm1.predict = predict(lm1, mydata)
> mean(abs(lm1.predict))
[1] 0.3294776
> mean(abs(mydata$Y))
[1] 1.206954
Does this mean that the linear regression variables I am using tend to underestimate the outcomes? Can any other conclusion be derived from this simple comparison?
EDIT
Another way to look at this is to calculate the absolute difference between each observation and the relative outcome:
> mean(abs(mydata$Y - lm1.predict))
[1] 1.208378
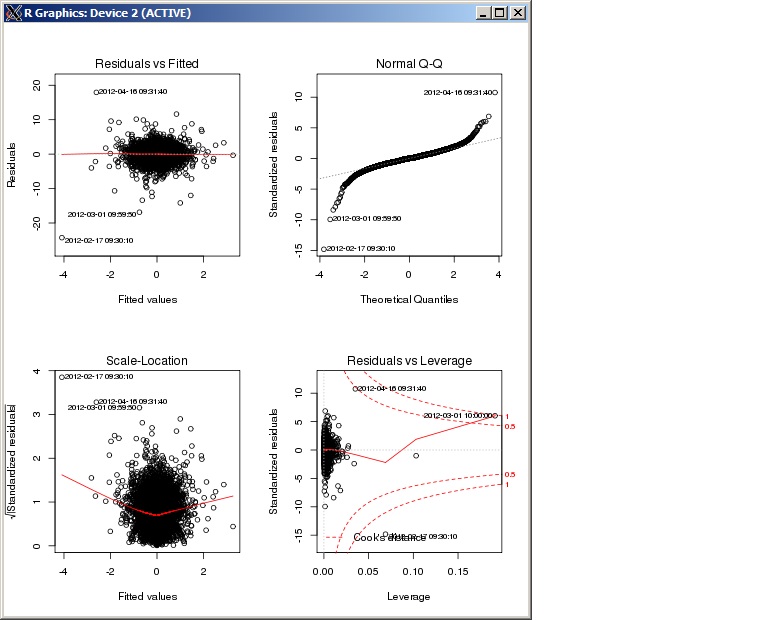
These are the diagnostic from the regression:

