0
$\begingroup$

I am using K-Means in order to cluster a population based on 5 variables into 2 groups. I am then using both tSNE and PCA to visualise the outcome to somehow better understand the separation.

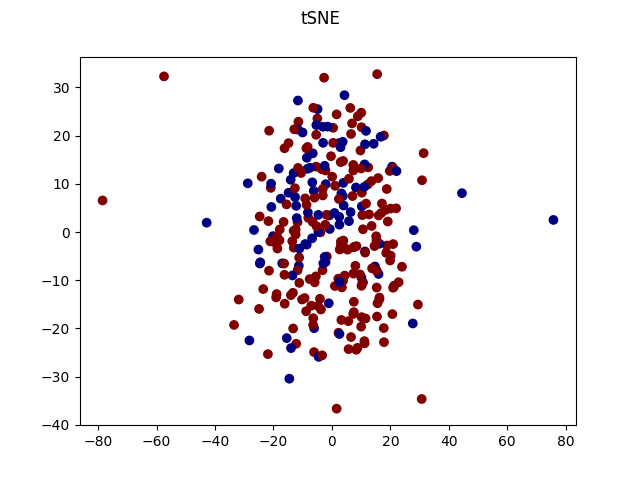
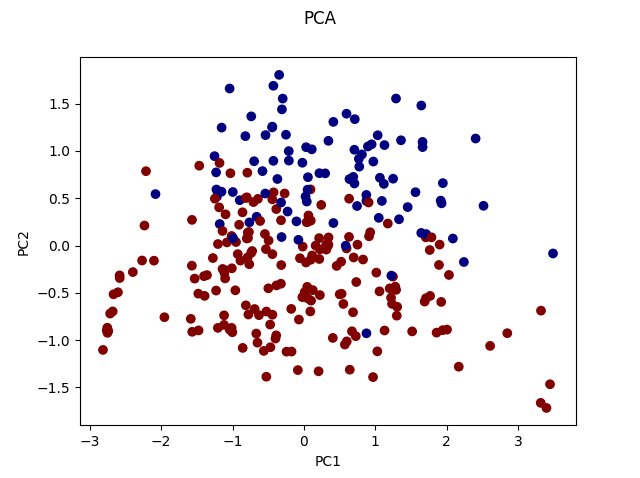
What is confusing me is that PCA shows a reasonably nice separation of the data whilst tSNE does not show the same pattern.

What is the best way to describe these differences? Which one is likely a better representation of the data?

PCA projection

tSNE projection

$\endgroup$
6
  • 2
    $\begingroup$ I don't see any meaningful separation on your Figure 1. You seem to have 1 cluster that you chopped in two parts with k-means. T-SNE does not care about faithfully representing the "shape" of the dataset and only tries to detect local clusters. If there are no separate clusters, you will get one blob which is what you see on Figure 2. $\endgroup$
    – amoeba
    Commented May 8, 2017 at 9:57
  • $\begingroup$ I agree there is no separation in either plot. However with PCA the separation is in 2 clear halves meaning there is some congruence between the values in each group rather than random split? $\endgroup$
    – JP1
    Commented May 8, 2017 at 10:22
  • $\begingroup$ Well, of course, you split the data via k-means so it kind of has to look like that. $\endgroup$
    – amoeba
    Commented May 8, 2017 at 10:52
  • $\begingroup$ Try other tSNE parameters, I.e. smaller or larger perplexity. But either way, this result does not look too good. $\endgroup$ Commented May 8, 2017 at 20:25
  • $\begingroup$ Yes, thanks for the comment. This is something that I have experimented with but to no avail. I think this post was perhaps more of a sanity check to make sure I wasnt doing something completely wrong. the t-test p-value between the 2 groups on other metrics (not used for clustering) shows significance, but replicablility is perhaps fleeting. $\endgroup$
    – JP1
    Commented May 9, 2017 at 13:20

1 Answer 1

1
$\begingroup$

This post covers key considerations when trying to get t-SNE to converge on a "correct" result: http://distill.pub/2016/misread-tsne/

I have found in my own applications on data that is ~1e5 features by ~1e2 samples that the number of training iterations, the learning rate, and the perplexity can all interact to determine whether the algorithm converges on something sensible. Also, why are you preceding t-SNE with k-means? Can you not proceed directly to t-SNE with the raw or standardized data?

In my experience, perplexity tends to be in the range of how many samples you think might be in any given cluster; e.g. if I have 18 samples and 10000 features, and I suspect samples might break down into 3-6 groups based on a priori metadata, I might expect a useful perplexity to be in the range of 3-6 or so, which is far from the defaults in TSNE within sklearn.manifold.

The training iterations and learning rate interact to generate a good result as well. If the learning rate is too high or low it might overshoot or never arrive at a result; note that the problem is not convex (doesn't have one solution). If the number of iterations is too low it might also not find a sensible solution. In either case, you can expect diffuse cloud-like or highly concentrated clustering if any of the above or combination thereof is off. Experiment with various orders of magnitude of these hyperparameters and note the difference between results.

It helps to have some benchmark of what you might expect with the clustering, for instance known population stratification of samples, which you can use to subjectively evaluate if t-SNE is capturing something useful.

$\endgroup$
5
  • $\begingroup$ Thanks for a great answer. The challenges I face, as pointed out by some others is that I am working with 5 features, not 1e5, which may be slightly reductive but is what I have to work with. I still have some work to do, and have been looking more into feature generation (polynomials, kernal trick?) to expand the feature set although this will of course be reduced to a function of what already exists. I do have a high number of samples comparativley (3000) but still "small data". Do you have any input on what to do with such a data set? $\endgroup$
    – JP1
    Commented Jun 6, 2017 at 7:42
  • $\begingroup$ I think you might have enough features. Questions: 1. Have you tried proceeding directly to t-SNE with your data? 2. Have you tried coloring your plot points according to some metadata to have a better sense of whether t-SNE is capturing something useful? 3. Do the features share the same data type? If not, you might want to normalize it across all your samples or log-transform it before any clustering. $\endgroup$ Commented Jun 6, 2017 at 18:06
  • 1
    $\begingroup$ General tip: if you think a set of hyperparameters has worked, re-run it several times with the same parameters to make sure-- t-SNE is fully able to randomly converge on seeming structure from random input. The data might rotate, but it should retain the overall topology. $\endgroup$ Commented Jun 6, 2017 at 18:18
  • $\begingroup$ 1. Yes I have used tSNE alone (pictured above) but there does not seem to be a nice separation of patients. 2. I tried colouring with respect to most meta data I have: age, labels, change in other features. there is no clear pattern that something has been captured, but perhaps a combination of them..? 3. My data generally has a large negative skew and is not measured on a standard scale. for this reason i log transformed and normalised each of the variables before hand. What is also apparent is that each run of tSNE does not look the same :) $\endgroup$
    – JP1
    Commented Jun 7, 2017 at 10:19
  • $\begingroup$ Ah-- sorry I misread your post re: using t-SNE alone. If you aren't getting consistent output then either it isn't converging or there might not be any structure to find. All I can suggest is to play with the hyperparameters or else try other clustering and visualization techniques; e.g. hierarchical with various distance metrics other than Euclidean and heatmaps/clustermaps. There are also good old-fashioned pair plots of variables (5x5 in your case) to see if anything jumps out, as well as pair plots of all the PC's... Good luck! $\endgroup$ Commented Jun 7, 2017 at 20:32

Your Answer

By clicking “Post Your Answer”, you agree to our terms of service and acknowledge you have read our privacy policy.

Not the answer you're looking for? Browse other questions tagged or ask your own question.