The relative asymptotic power of non-parametric tests is reported to be high. What is the power of tests such as Wilcoxon Signed Rank Test and Mann-Whitney U with N's of 10, 20, 50, for example, as compared with t-tests?
1 Answer
As mentioned in the comments, this question has no answer because it depends on extra assumptions: the alpha level of the test, the distribution of your sample and whether or not you assume independence.
If you make those assumptions, we can get the answer with R. For example, assuming that variables are Gaussian and independent you can get the relative power with the following code:
relative_power <- function(n, delta, alpha = 0.05, resampling = 100000) {
   # n: size of each Gaussian sample (with variance = 1).
   # delta: difference in mean between the samples.
   # alpha: level of the test (default 5%).
   # resampling: number of simulations (default 10000).
   reject_t <- reject_w <- rep(NA, resampling)
   for (i in 1:resampling) {
      # Here we assume that sampling is Gaussian and independent.
      # Change those lines to whatever distribution you assume.
      sample_A <- rnorm(n)
      sample_B <- rnorm(n, mean = delta)

      # Here we assume that we compare a t test to a Wilcoxon test.
      # Change those lines to whatever tests you want to compare.
      reject_t[i] <- t.test(sample_A, sample_B)$p.value < alpha
      reject_w[i] <- wilcox.test(sample_A, sample_B)$p.value < alpha
   }
   # Return the ratio of rejection of the Wilcoxon test to t test.
   return (sum(reject_w) / sum(reject_t))
}
With this you can get a relative power curve as follows.
r_pow_30_5_percent <- rep(NA, 21)
delta <- seq(from = -1, to = 1, length.out = 21)
# The following loop takes a bit of time...
for (i in 1:21) {
    r_pow_30_5_percent[i] <- relative_power(n = 30, delta[i])
}
plot(delta, r_pow_30_5_percent, xlab = "delta",
   ylab = "Relative power", type = 'l')
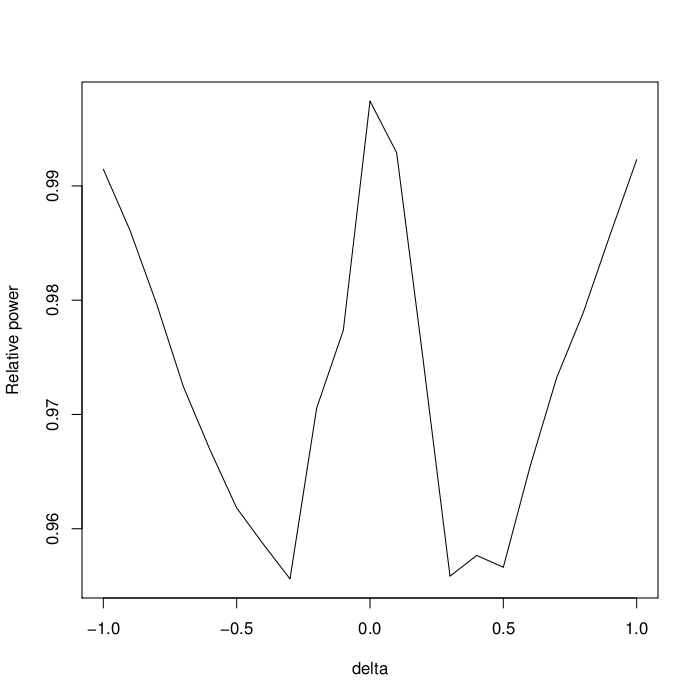
To save you the trouble of running this (quite long) simulation, here is the picture I got.

As you can see, the relative power is W-shaped with a minimum for delta around 0.3 standard deviations. Yet the variation is not very large: in this particular case, the relative power does not vary by more than 5%. Also note that the value for delta = 0 should be exactly 1 because both tests have exactly the same chance of rejecting the null hypothesis (namely 5% in this case).
-
$\begingroup$ Thank you for providing this elegant simulation! However, I wonder if the results make sense. Is there so little information in the interval level data that a rank order test that ignores that information can be 96 to 99% as effective as a parametric test that uses that information (with an N of only 30)? $\endgroup$– Joel W.Commented May 10, 2012 at 12:48
-
$\begingroup$ Yes, the W shape was expected, but the fact that the relative power does not vary by more than 5% surprised me too. As far as I can judge I do not see any error in the code, so this means that the power cost of using Wilcoxon test is smaller than claimed (in this particular case). $\endgroup$ Commented May 13, 2012 at 22:15
-
$\begingroup$ Does the relative power drop off quickly for smaller N's? What might the relative power be for an N of 5? (I have yet to learn R, unfortunately.) $\endgroup$– Joel W.Commented May 14, 2012 at 18:37

replicate(). The paper I linked contains simulation research. If you want pretty math instead, this is a classic paper. $\endgroup$