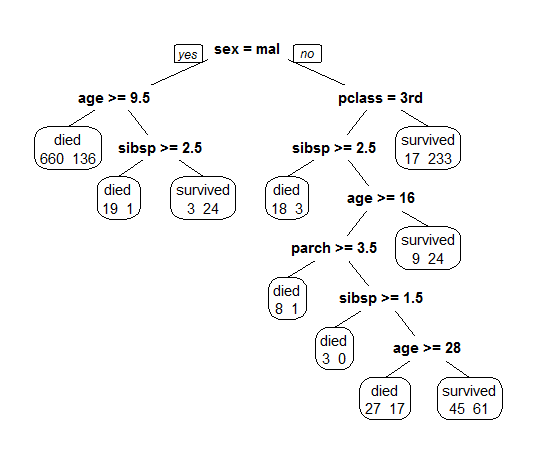
1
$\begingroup$

I have a problem understanding the behavior of rpart function of R.

Here is the r code part :

library(rpart);

library(rpart.plot)

data(ptitanic); 

attr(ptitanic$age,"class") <- NULL;

class(ptitanic$age);

#This is a function which draws the tree 

arbre=function(data){

  set.seed(415)

   ptitanicTree  = rpart(survived~., data = data, 
                        control = rpart.control(minsplit = 5, cp = 0), 
                        method = "class")       


   ptitanicOptimal = prune(ptitanicTree, 
                           cp = ptitanicTree$cptable[which.min(ptitanicTree$cptable[,4]),1] )


   prp(ptitanicOptimal,extra=1)
}

data1=ptitanic[,c(1,2,3,4,5,6)];

arbre(data1)

# I change the position switching column 5 and 6
data2=ptitanic[,c(1,2,3,4,6,5)];

# Here i get an another tree : why ?
arbre(data2)

Is anyone able to explain why we get two different trees we have only changed the position of columns in data input ?

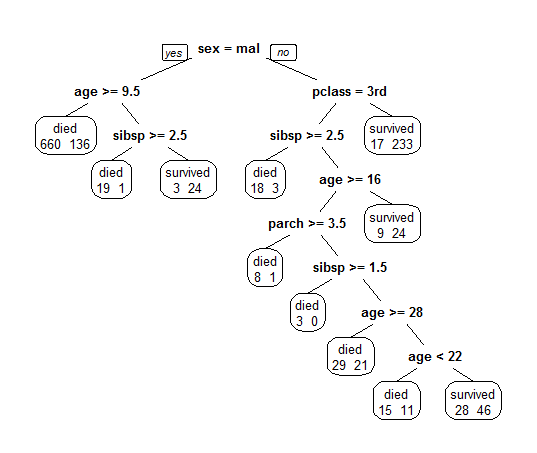
First Tree Second Tree

$\endgroup$
7
  • $\begingroup$ You did not provide a reproducible example, there is no ptitanic data in base R, nor in rpart package. As about the results, they are nearly the same -- the only difference is that pruning returned one extra level. $\endgroup$
    – Tim
    Commented Jun 16, 2017 at 14:24
  • $\begingroup$ @tim : thank's I have edited the post, the data frame is in the R package rpart.plot (also used to plot the trees). Best regards $\endgroup$
    – TheBridge
    Commented Jun 16, 2017 at 14:35
  • $\begingroup$ By the way the parameter "cp" seems involved in this curious behavior but I can't explain how. regards $\endgroup$
    – TheBridge
    Commented Jun 16, 2017 at 14:38
  • $\begingroup$ Please indent your code properly when asking others to read it. $\endgroup$ Commented Jun 16, 2017 at 15:19
  • $\begingroup$ You might get more responses if your change your title. Your title Understanding rpart package is too vague. A better title would be something like Why does rpart generate a different tree when the order of the variables in the data is changed?. $\endgroup$ Commented Aug 10, 2018 at 2:02

1 Answer 1

2
$\begingroup$

The rpart algorithm can generate different trees when the order of the variables is changed because it's a greedy algorithm. At each step when when growing the tree, it may so happen that the optimum Gini Impurity may be achieved by more than one potential split-variable -- which of those variables is actually selected by the algorithm will depend on the order in which the algorithm scans the variables.

$\endgroup$
1
  • $\begingroup$ Thanks for changing the title to be more informative for others who have the same question. $\endgroup$ Commented Aug 10, 2018 at 17:19

Your Answer

By clicking “Post Your Answer”, you agree to our terms of service and acknowledge you have read our privacy policy.

Not the answer you're looking for? Browse other questions tagged or ask your own question.