5
$\begingroup$

I have a discrete stochastic process $X(t)$ which I believe is a Poisson process, that is the value of $X(t)$ at time $t$ is a Poisson random variable with parameter $\lambda t$ and disjoint intervals are assumed to be independent.

Due to the nature of the data I only have values of $X(t)$ at discrete and fixed times $t_1, t_2, .., t_n$. Meaning that rather than having single jumps of size one I have jumps of multiple steps between times $X(t)$ is measured.

The times $t_1, t_2, .., t_n$ are not the actual 'arrival times' of the Poisson process. They are simply times when 'an observer' has decided to check the process's value X(t). The real 'arrival times' are completely unknown.

Does it make sense to think of $X(t)$ as a Poisson process when the exact times of arrival are unknown? Or is it a pointless endeavour?

If it does make sense, are there any tests one would recommend in this context?

$\endgroup$
9
  • $\begingroup$ The $t_i$ values are not known? If not, is anything known/reasonably assumed about how they're distributed? (e.g. would exponentially distributed intervals make sense?) $\endgroup$
    – Glen_b
    Commented Jun 26, 2017 at 0:00
  • $\begingroup$ Sorry that was very poorly worded on my part (fixed). I have the $t_i$ which are known, alongside which we have $X(t_i)$. However, these $t_i$ are not the actual "arrival times". They are simply the value of the process $X(t_i)$ at time $t_i$. I meant "random" in the sense that they are given in no real systematic way. The actual arrival times are unknown, however I assume that time between the unknown arrival times is exponentially distributed. $\endgroup$
    – Patty
    Commented Jun 26, 2017 at 3:24
  • $\begingroup$ I had not considered the distribution of these time intervals $\Delta t_i = t_i - t_{i-1}$ and was simply treating them as non-random. In the sense that an observer checks the price at these times, not knowing himself when the process is jumping. Is that clearer? If not, I can try to explain better. Thanks Glen. $\endgroup$
    – Patty
    Commented Jun 26, 2017 at 3:29
  • 2
    $\begingroup$ If the times are known there's no issue -- the distribution question was only if they were unknown. With known times you have exposure values and calculations should be straightforward; What are you trying to find out?? e.g. are you trying to estimate $\lambda$? construct a prediction interval for the number of events in some future time period? something else? $\endgroup$
    – Glen_b
    Commented Jun 26, 2017 at 5:29
  • 1
    $\begingroup$ This is a special case of a Poisson GLM using a non-canonical link. The number of arrivals between $t_{i-1}$ and $t_i$ is Poisson with expectation $\lambda \Delta t_i$ and much of GLM theory holds. $\endgroup$
    – Yves
    Commented Jun 26, 2017 at 9:08

1 Answer 1

3
$\begingroup$

An answer partly depends on what you mean by the word "test" there.

If you're after a formal hypothesis test, one could try to perform some test based on the likelihood or the log of the likelihood (as per Fisher) or if there's a specific alternative via a likelihood ratio test, though various tests might be devised depending on broader classes of alternatives that should perform pretty well.

My advice would not be to pursue formal tests of goodness of fit. Our models are (usually) just that -- models, not perfect descriptions. As such in large samples they're clearly wrong (even though the model may be a very good description of the thing we're modelling) and in small samples the fact that we can't clearly tell these models are wrong should be no consolation, since in a small sample even a quite poor model may be hard to clearly identify. A clearly wrong model - one we would reject via a test - may remain highly useful, if the deviation from correctness has small effects on our inference (i.e. we're dealing more with raw-effect-size type problems rather than statistical significance)

As such I'd tend to lean toward diagnostic displays rather than formal tests, though if you can be much more specific about what effects will matter, there may be some uses for testing.

One approach to displays would be to check the mean-variance relationship. In particular, if we let $Y_i$ be the $i$-th increment in count and we let $s_i$ be the corresponding increment in time, then under the Poisson assumption $Y_i\sim \text{Pois}(\lambda s_i)$. If it's Poisson the mean should be proportional to $s_i$ and the variance should be proportional to $s_i$ (or standard deviation proportional to $\sqrt{s_i}$).

This is easier to see on the square root scale. If the Poisson means are not typically very small (so the observations aren't nearly all 0 or 1) you can plot either $\sqrt{y_i+\frac38}$ or $\sqrt{y_i}+\sqrt{y_i+1}$ against $\sqrt{s_i}$ -- either one should look approximately linear with fairly constant spread:
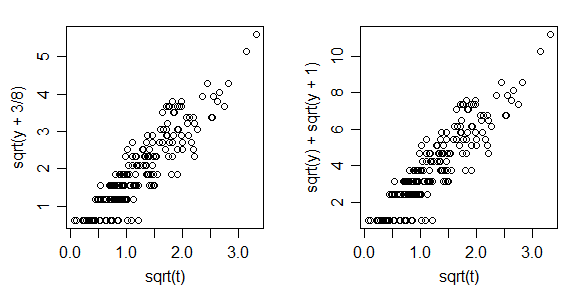
plot of square root of (y(i)+3/8) vs square root of s(i) and square root of y(i) plus square root of 1+y(i) vs square root of s(i)

The first transformation in the Anscombe transformation for the Poisson, the second is the Freeman-Tukey transformation.

It's possible to adjust the $\sqrt{s_i}$ for each plot to be closer to the expected value of the transformed $Y$ for small $\lambda s_i$ which can improve the appearance of the plot a bit when the mean is smaller, but it's usually not necessary.

There are other options that can work as well.

You might even consider an examination of a suitable choice of residuals vs fitted and a scale vs fitted from a constant-only Poisson glm fit with log link and an offset of $\log(s_i)$, but these can be considerably harder to interpret. This is one where the model is correct (the same data as above):
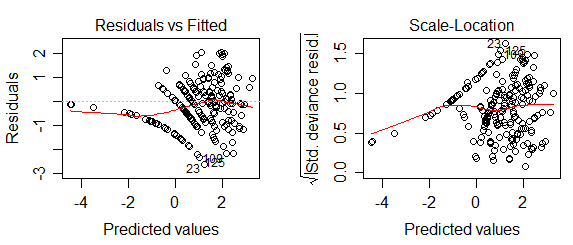
Residual plots from a glm fit

(Personally I find the earlier plots easier to judge)

$\endgroup$
3
  • $\begingroup$ This is an excellent answer and has helped me a lot to better understand what I actually want to do. Given the size of my data (10's of millions of data points) it was probably quite naive of me to attempt to formally test it. Will keep this in mind in future. Thanks a lot Glen, big help as usual. $\endgroup$
    – Patty
    Commented Jun 27, 2017 at 21:14
  • $\begingroup$ With tens of millions of points, there's other things still that you could do both in the direction of displays and in formal testing (which will almost certainly reject of course). ... ctd $\endgroup$
    – Glen_b
    Commented Jun 27, 2017 at 22:00
  • $\begingroup$ ctd... For example, another display -- if one bins on the time increments $s_i=t_i-t_{i-1}$ (where $t_0$ is the start of the observation period), and looks at tables of counts of the number of $x_k=\#\{y_i=k\}$ within each $s$-bin then one might produce a modified version of a Poissonness plot (in this case requiring plotting a transformed $x$ vs a transformed $k$ and some representative value for the $s$-bin - i.e. a 3D plot) which should be linear in both directions. $\endgroup$
    – Glen_b
    Commented Jun 27, 2017 at 22:01

Your Answer

By clicking “Post Your Answer”, you agree to our terms of service and acknowledge you have read our privacy policy.

Not the answer you're looking for? Browse other questions tagged or ask your own question.