8
$\begingroup$

I am looking at learning curves (CNN for text classification, which is based on this paper) and trying to play with regularization to prevent overfitting. This model uses L2 regularization and dropout.

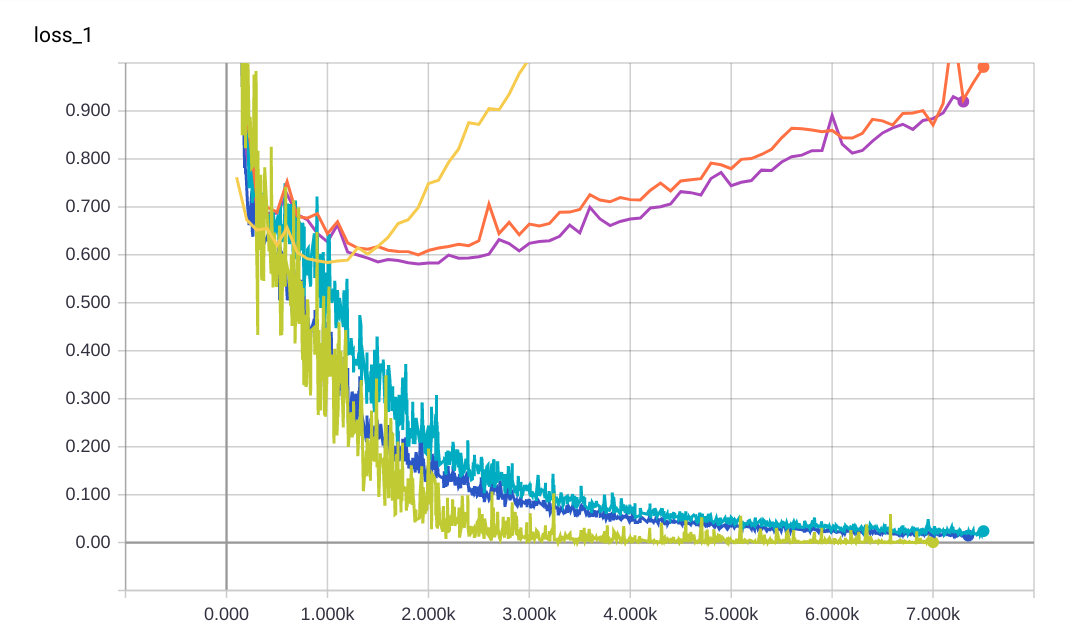
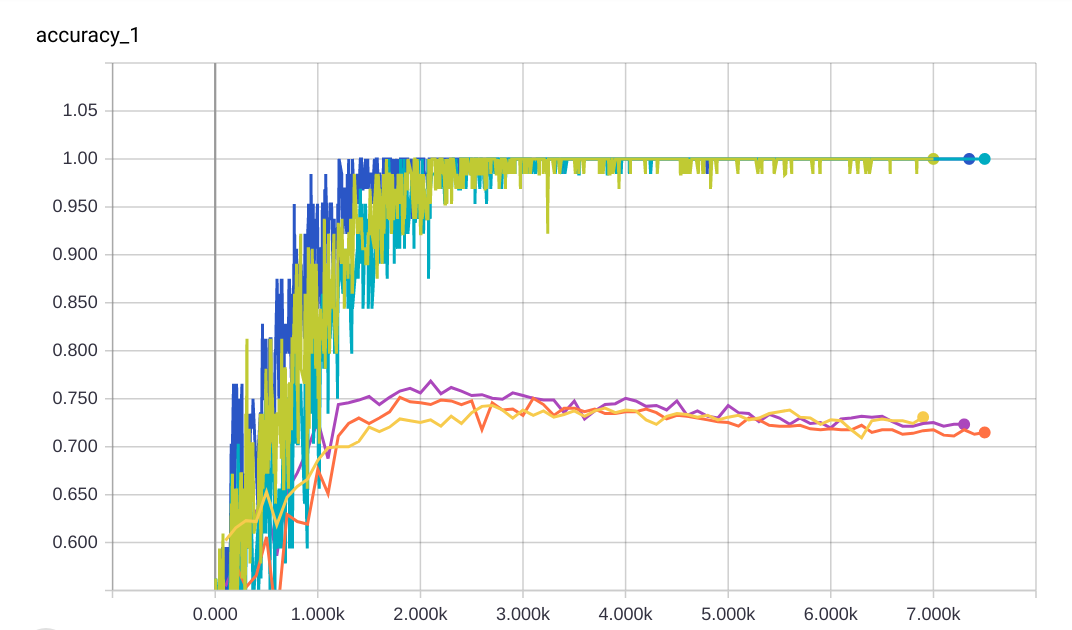
What is interesting is that by looking at the accuracy graph I cannot really tell which model is the best. On the other hand the loss graph shows some differences. See pictures below.

Here are my question:

  • should we always look at the loss curves to check for overfitting?
  • the accuracy graph is not very precise because accuracy is discrete and a lot of information gets lost when we compute it?

enter image description here

enter image description here

$\endgroup$

1 Answer 1

6
$\begingroup$

Accuracy is not a great way to report machine learning results. (I've never found a need to report accuracy, except when explaining my results to a non-technical audience.) Accuracy only compares a predicted score $t$ to some cutoff $c$, which is not a proper scoring rule and conceals important information about model fitness.

I assume you're using some sort of proper loss function in the "loss" graph, such as cross-entropy loss. Cross-entropy loss is more useful than accuracy because it is sensitive to "how wrong" its results are: if the label is $1$ but $t=0.9$, the cross-entropy is lower than when the label is $1$ but $t=0.1$.

The phenomenon you're seeing when comparing these two graphs -- accuracy is flat but loss is increasing -- happens because $t>c$ is satisfied in the accuracy graph, but the predicted scores are poorly aligned to their labels.

This is intimately related to this similar issue with AUC: Why is AUC higher for a classifier that is less accurate than for one that is more accurate?

$\endgroup$
6
  • $\begingroup$ Thank you very much for the answer. I was going to ask about AUC, but you already answered my question. So AUC is not a good measure too? $\endgroup$
    – Yuri
    Commented Aug 28, 2017 at 18:42
  • 1
    $\begingroup$ Quite the opposite -- AUROC is a measurement based on the relative ranks of the scores for positives and negatives, specifically the probability that a random positive is ranked higher than a random negative. This is sensitive, indirectly, to the alignments of scores and labels, and "how wrong" the classifier is on average. Moreover, the operating points give information about tradeoffs of errors are different cutoffs. $\endgroup$
    – Sycorax
    Commented Aug 28, 2017 at 18:44
  • $\begingroup$ But the first comment under the link you provided says: "I wish I had a good reference for that, but briefly any measure based solely on ranks such as cc (AUROC) cannot give enough credit to extreme predictions that are "correct". Brier, and even more so the logarithmic scoring rule (log likelihood) give such credit. This is also an explanation why comparing two cc-indexes is not competitive with other approaches power-wise" $\endgroup$
    – Yuri
    Commented Aug 28, 2017 at 19:17
  • 1
    $\begingroup$ All of that is true. But it's also true that Brier scores and log-likelihood don't report the same information as ROC curves. Hammers aren't screwdrivers. $\endgroup$
    – Sycorax
    Commented Aug 28, 2017 at 19:18
  • $\begingroup$ Also talking about reporting accuracy. For example, in this paper arxiv.org/abs/1408.5882 the author reports exactly accuracy. Or you are saying he checked his model for overfitting using the cross entropy and then reported only accuracy? $\endgroup$
    – Yuri
    Commented Aug 28, 2017 at 22:13

Your Answer

By clicking “Post Your Answer”, you agree to our terms of service and acknowledge you have read our privacy policy.

Not the answer you're looking for? Browse other questions tagged or ask your own question.