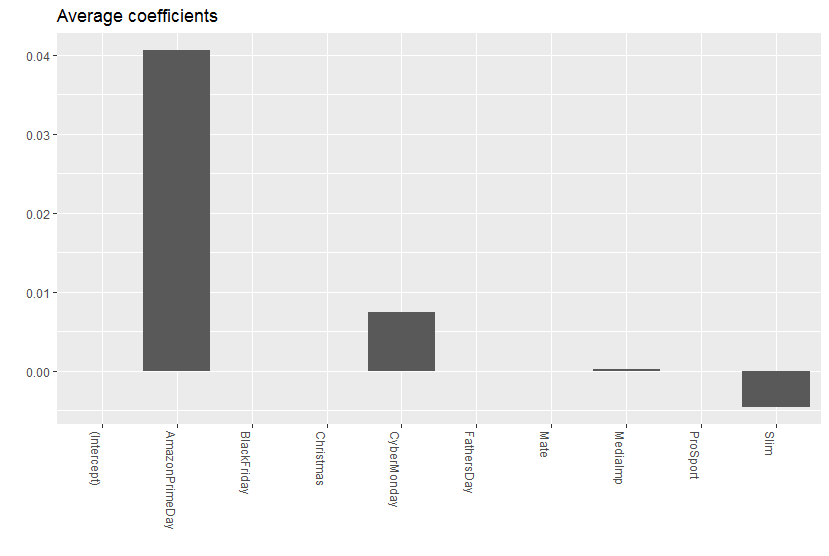
The documentation for BSTS says the following about coefficients
If object contains a regression component then the output contains matrix with rows corresponding to coefficients, and columns corresponding to:
The posterior probability the variable is included.
The posterior probability that the variable is positive.
The conditional expectation of the coefficient, given inclusion.
The conditional standard deviation of the coefficient, given inclusion.
A there are several examples online of researchers using BSTS and showing a plot similar to the one below> I am not sure how to interpret the Y-axis. I read through the documentation, but it is still not clear to me. Does anyone use this package? 
$\begingroup$
$\endgroup$
Add a comment
|
1 Answer
$\begingroup$
$\endgroup$
If I understand what you are plotting correctly the y-axis corresponds to the expected value of the coefficient's posterior, for the regression component of the model.
On the model$coefficients matrix the columns correspond to the predictors, and rows to the MCMC steps.
