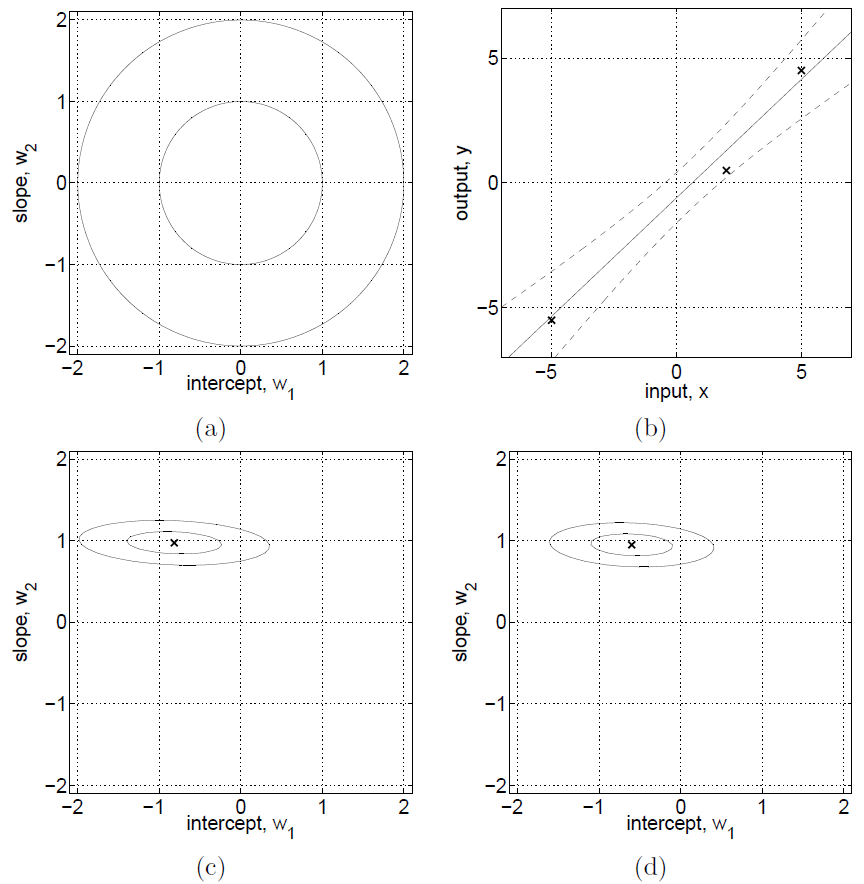
I'm new to Bayesian analysis, and still getting acquainted to some of the basic ideas. I'm working through Gaussian Processes for Machine Learning. Stepping through Chapter 2 I'm very confused with this Figure 2.1, page 10 showing an example of a Bayesian linear model.

Here (a) shows the prior, p(w)~N(0,I), (b) shows training points, (c) shows "contours of the likelihood p(y|X,w) ... assuming a noise level of sigma_n = 1" and (d) shows the posterior.
What's confusing me about this plot is that the likelihood function given by R&W is $$ p(\mathbf{y}|X,\mathbf{w}) = \mathcal{N}(X^T\mathbf{w},\sigma_n^2 I) $$ where $\sigma_n=1$. So could anyone help me understand the following?
- Since the mean of the likelihood distribution is itself dependent upon the parameters $\mathbf{w}$, what is used for the mean in this plot (c)?
- The covariance matrix for the likelihood is stated as $\sigma_n^2 I$, so I would expect the distribution to be symmetric, but in the plot it clearly isn't. Why?
