I'm trying to figure out which "average" and "deviation" statistics are most appropriate for a software benchmark I'm creating.
For background: I am benchmarking programs whose task is to read in a given set of 'definitions' written in some programming language (e.g. a plus function, a sort function, etc.), and after some amount of time halt and output some 'conjectures' about those definitions (e.g. plus is commutative, sort is idempotent, etc.).
I have a reasonable (IMHO) method to measure the "quality" of the output, using precision and recall against a ground truth corpus, but I'm unsure how to most appropriately aggregate the run times.
In my approach I have a corpus with ~400 definitions, and I'm sampling 30 subsets of size 1, 30 subsets of size 2, and so on up to size 20 (anything larger and the programs become infeasibly slow). I chose 30 since it's a rule of thumb for avoiding 'small sample statistics'; in particular, as a separate analysis to my current question, I want to allow comparison between different programs using a paired difference test, and 30 samples should be enough to justify using a paired Z-test rather than a Wilcoxon signed-rank test.
Back to my current question: for each subset, we run the program once, with a timeout of 1 hour. I want to combine these 30 runtimes to get an "average" and a "spread" for each sample size, to see how the program "scales" as the size increases. In theory, all programs I'm testing are exponential time; but this may not hold empirically, due to various confounding factors I would like to subsequently explore.
At the moment I am considering using the median to report the "average value" and the mean absolute deviation (MAD) to report the "spread around the average". This is because the 'go-to' statistics of mean and standard deviation don't seem representative, given the highly non-normal distribution of my data.
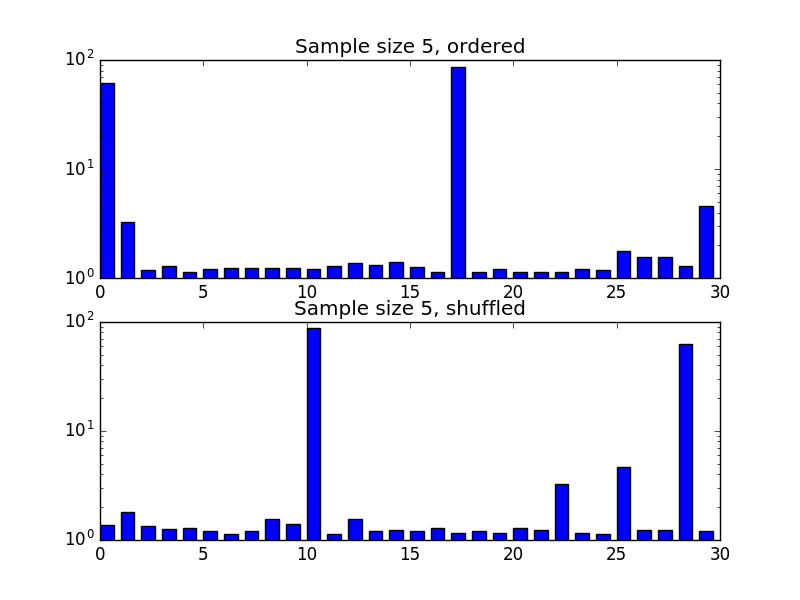
For example, here are the runtimes of one program for 30 samples of size 5. The y axis is logarithmic, and shows runtime in seconds. The x axis of the top graph is in the order that the data were obtained, the bottom graph shows the same data but in a shuffled order (I used these graphs to eyeball whether the results appear independent, e.g. to ensure they weren't getting faster over time due to caching, or other such effects).
So my questions are:
- Do median and MAD seem reasonable, given my data and my goals?
- Does my approach seem reasonable? Perhaps it's more appropriate to consider these as 'survival times'? I also considered 'fitting a power law' to normalise the data, but this seems problematic due to the dominance of large values, which are also those with the sparsest data.

