32
$\begingroup$

Questions:

  1. I have a large correlation matrix. Instead of clustering individual correlations, I want to cluster variables based on their correlations to each other, ie if variable A and variable B have similar correlations to variables C to Z, then A and B should be part of the same cluster. A good real life example of this is different asset classes - intra asset-class correlations are higher than inter-asset class correlations.

  2. I am also considering clustering variables in terms stregth relationship between them, eg when the correlation between variables A and B is close to 0, they act more or less independently. If suddenly some underlying conditions change and a strong correlation arises (positive or negative), we can think of these two variables as belonging to the same cluster. So instead of looking for positive correlation, one would look for relationship versus no relationship. I guess an analogy could be a cluster of positively and negatively charged particles. If the charge falls to 0, the particle drifts away from the cluster. However, both positive and negative charges attract particles to revelant clusters.

I apologise if some of this isn't very clear. Please let me know, I will clarify specific details.

$\endgroup$
2
  • 1
    $\begingroup$ Would factor analysis not do the job for qn 1? Question 2 is a bit vague. 'Relationship' seems a synonym for 'correlation' or at least one form of relationship is linear relationship and correlation captures that. Perhaps, you need to clarify qn 2. $\endgroup$
    – user28
    Commented Sep 22, 2010 at 17:08
  • $\begingroup$ You have stated what you want to do. What is your question? Is it about implementation or whether your analysis approach is appropriate? or something else? $\endgroup$ Commented Sep 23, 2010 at 1:21

2 Answers 2

17
$\begingroup$

Here's a simple example in R using the bfi dataset: bfi is a dataset of 25 personality test items organised around 5 factors.

library(psych)
data(bfi)
x <- bfi 

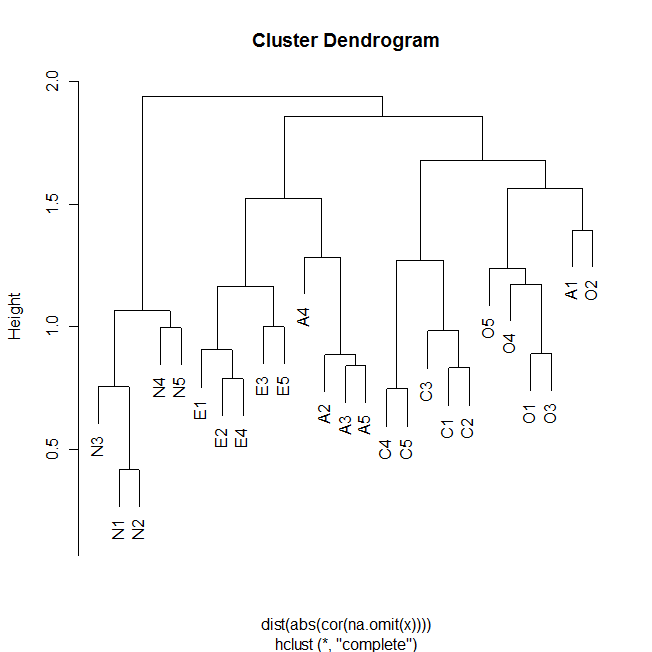
A hiearchical cluster analysis using the euclidan distance between variables based on the absolute correlation between variables can be obtained like so:

plot(hclust(dist(abs(cor(na.omit(x))))))

alt text The dendrogram shows how items generally cluster with other items according to theorised groupings (e.g., N (Neuroticism) items group together). It also shows how some items within clusters are more similar (e.g., C5 and C1 might be more similar than C5 with C3). It also suggests that the N cluster is less similar to other clusters.
Alternatively you could do a standard factor analysis like so:

factanal(na.omit(x), 5, rotation = "Promax")


Uniquenesses:
   A1    A2    A3    A4    A5    C1    C2    C3    C4    C5    E1    E2    E3    E4    E5    N1 
0.848 0.630 0.642 0.829 0.442 0.566 0.635 0.572 0.504 0.603 0.541 0.457 0.541 0.420 0.549 0.272 
   N2    N3    N4    N5    O1    O2    O3    O4    O5 
0.321 0.526 0.514 0.675 0.625 0.804 0.544 0.630 0.814 

Loadings:
   Factor1 Factor2 Factor3 Factor4 Factor5
A1  0.242  -0.154          -0.253  -0.164 
A2                          0.570         
A3         -0.100           0.522   0.114 
A4                  0.137   0.351  -0.158 
A5         -0.145           0.691         
C1                  0.630           0.184 
C2  0.131   0.120   0.603                 
C3  0.154           0.638                 
C4  0.167          -0.656                 
C5  0.149          -0.571           0.125 
E1          0.618   0.125  -0.210  -0.120 
E2          0.665          -0.204         
E3         -0.404           0.332   0.289 
E4         -0.506           0.555  -0.155 
E5  0.175  -0.525   0.234           0.228 
N1  0.879  -0.150                         
N2  0.875  -0.152                         
N3  0.658                                 
N4  0.406   0.342  -0.148           0.196 
N5  0.471   0.253           0.140  -0.101 
O1         -0.108                   0.595 
O2 -0.145   0.421   0.125   0.199         
O3         -0.204                   0.605 
O4          0.244                   0.548 
O5  0.139                   0.177  -0.441 

               Factor1 Factor2 Factor3 Factor4 Factor5
SS loadings      2.610   2.138   2.075   1.899   1.570
Proportion Var   0.104   0.086   0.083   0.076   0.063
Cumulative Var   0.104   0.190   0.273   0.349   0.412

Test of the hypothesis that 5 factors are sufficient.
The chi square statistic is 767.57 on 185 degrees of freedom.
The p-value is 5.93e-72 
$\endgroup$
10
  • 2
    $\begingroup$ Hi Jeromy. Q: what does it mean to take the dist of abs(cor(...)) ? Isn't a cor matrix is one where a larger number indicate more of a relation, while in a distance matrix the opposite is true? (I suspect I am missing something, could you please explain?) $\endgroup$
    – Tal Galili
    Commented Oct 29, 2010 at 7:47
  • 2
    $\begingroup$ using a 1-abs(cor...) would make more sense to me :) $\endgroup$
    – Tal Galili
    Commented Oct 29, 2010 at 12:06
  • 1
    $\begingroup$ @Tal the dist option: each variable has a vector of absolute correlations. Variables with more similar vectors would have smaller euclidean distances: en.wikipedia.org/wiki/Euclidean_distance $\endgroup$ Commented Oct 31, 2010 at 2:21
  • 1
    $\begingroup$ @Tal I'll second Jeromy on that point. Correlations (or $1-r$) are useful metric for clustering or PCA, and sometimes $1-|r|$ are preferred simply because a negative correlation may be considered as informative as a positive one. Taking the complementary value just amount to work with dissimilarities rather than similarities (the same consideration applies in MDS). $\endgroup$
    – chl
    Commented Nov 1, 2010 at 13:22
  • 1
    $\begingroup$ I agree with @Tal Galili ; in the (abundant) literature of clustering financial time series, one uses hierarchical clustering on the transformed correlation matrix. A big part of the literature use the transformation $\sqrt{2(1-\rho)}$ (for some reasons detailed in Mantegna's and Stanley's book An introduction to econophysics - Correlations and Complexity in Finance). (Personally, I prefer $(1-\rho_S)/2$ with $\rho_S$ Spearman correlation.) Then, those guys use average or single linkage (since they have the ultrametric property), but I prefer typically a Ward algorithm. $\endgroup$
    – mic
    Commented Nov 24, 2015 at 13:57
8
$\begingroup$

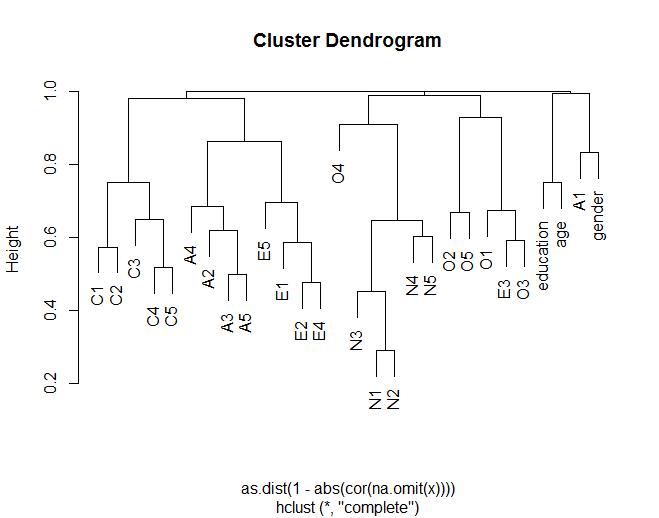
When Clustering Correlations it is important not to calculate the distance twice. When you take the correlation matrix you are in essence making a distance calculation. You will want to convert it to a true distance by taking 1 - the absolute value.

1-abs(cor(x))

When you go to convert this matrix to a distance object, if you utilize the dist function you will be taking the distances between your correlations. Instead you want to use the as.dist() function which will simply transform your pre-calculated distances into a into a "dist" object.

Applying this method to the Alglim example

library(psych)
data(bfi)
x <- bfi 
plot(hclust(as.dist(1-abs(cor(na.omit(x))))))

results in a different dendroggram Cluster Dendrogram

$\endgroup$

Your Answer

By clicking “Post Your Answer”, you agree to our terms of service and acknowledge you have read our privacy policy.

Not the answer you're looking for? Browse other questions tagged or ask your own question.