I'm trying to group correlated variables together. I calculated the correlation matrix (Pearson correlation) and filtered out insignificantly correlated variables.
What I'm left with is this correlation matrix (Python):
corr = np.asarray([[ 1.        , -0.0203017 ,  0.01597614, -0.08606197, -0.26817918,
                    -0.83517218,  0.00232017,  0.02080507, -0.04197305,  0.24193934,
                     0.55975631, -0.02848723,  0.11169831],
                   [-0.0203017 ,  1.        , -0.28871367,  0.07712827, -0.01872119,
                     0.00968394, -0.84190025,  0.29734194, -0.03691375, -0.05163921,
                     0.14567088,  0.31608445,  0.0089805 ],
                   [ 0.01597614, -0.28871367,  1.        ,  0.06309928, -0.0771897 ,
                     0.12276402,  0.23658969, -0.97003472, -0.04034719,  0.08949067,
                     0.10113853, -0.12953224,  0.07544441],
                   [-0.08606197,  0.07712827,  0.06309928,  1.        , -0.10443245,
                     0.1253936 , -0.04070633, -0.09509433, -0.82558084, -0.02611453,
                    -0.14586145,  0.20172068, -0.02510469],
                   [-0.26817918, -0.01872119, -0.0771897 , -0.10443245,  1.        ,
                     0.14518334, -0.01315547,  0.07084393,  0.13159619, -0.90127075,
                    -0.18569184, -0.05251947, -0.03355281],
                   [-0.83517218,  0.00968394,  0.12276402,  0.1253936 ,  0.14518334,
                     1.        ,  0.01061786, -0.14152792, -0.03568505, -0.11042734,
                    -0.34177675, -0.00435837, -0.03484822],
                   [ 0.00232017, -0.84190025,  0.23658969, -0.04070633, -0.01315547,
                     0.01061786,  1.        , -0.29191501, -0.03756422,  0.04060199,
                    -0.11910248, -0.11876712, -0.00102932],
                   [ 0.02080507,  0.29734194, -0.97003472, -0.09509433,  0.07084393,
                    -0.14152792, -0.29191501,  1.        ,  0.07295001, -0.05938729,
                    -0.04002804,  0.10546885, -0.03885392],
                   [-0.04197305, -0.03691375, -0.04034719, -0.82558084,  0.13159619,
                    -0.03568505, -0.03756422,  0.07295001,  1.        , -0.05371411,
                     0.12649711, -0.08835831,  0.04666688],
                   [ 0.24193934, -0.05163921,  0.08949067, -0.02611453, -0.90127075,
                    -0.11042734,  0.04060199, -0.05938729, -0.05371411,  1.        ,
                     0.21243162, -0.03047389,  0.0456781 ],
                   [ 0.55975631,  0.14567088,  0.10113853, -0.14586145, -0.18569184,
                    -0.34177675, -0.11910248, -0.04002804,  0.12649711,  0.21243162,
                     1.        , -0.01588074,  0.17283502],
                   [-0.02848723,  0.31608445, -0.12953224,  0.20172068, -0.05251947,
                    -0.00435837, -0.11876712,  0.10546885, -0.08835831, -0.03047389,
                    -0.01588074,  1.        , -0.005598  ],
                   [ 0.11169831,  0.0089805 ,  0.07544441, -0.02510469, -0.03355281,
                    -0.03484822, -0.00102932, -0.03885392,  0.04666688,  0.0456781 ,
                     0.17283502, -0.005598  ,  1.        ]])
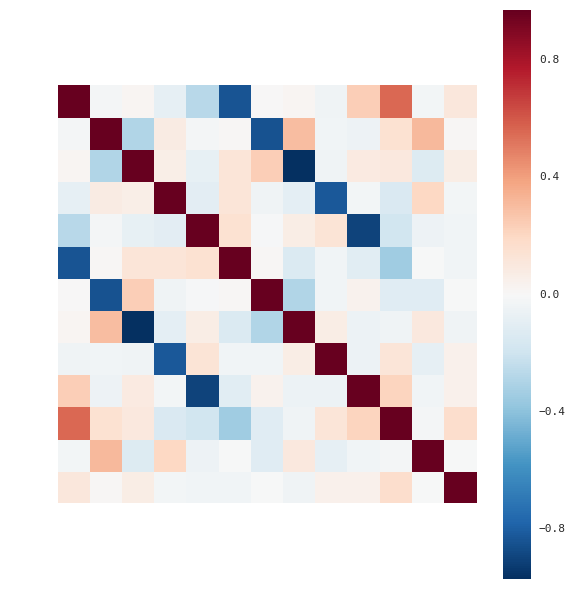
which I can plot as a heat map (red patches, are positively correlated, blue ones negatively):
Ideally, only positively correlated (red) variables get grouped together (variables that are only negatively correlated to all others should form their own 1-element cluster) and the number of groups (or clusters) should be small. I found this paper on correlation cluster by Bansal, Blum and Chawla, but as far as I understand it, they are only considering positive and negative correlations (not the degree of correlation).
At this point, I just need an algorithm to get me going; one that's "easy" to implement, published/referenceable (would be nice). I don't care about run-time performance or complexity too much, as at the moment I am only dealing with less than 20 variables.
Update
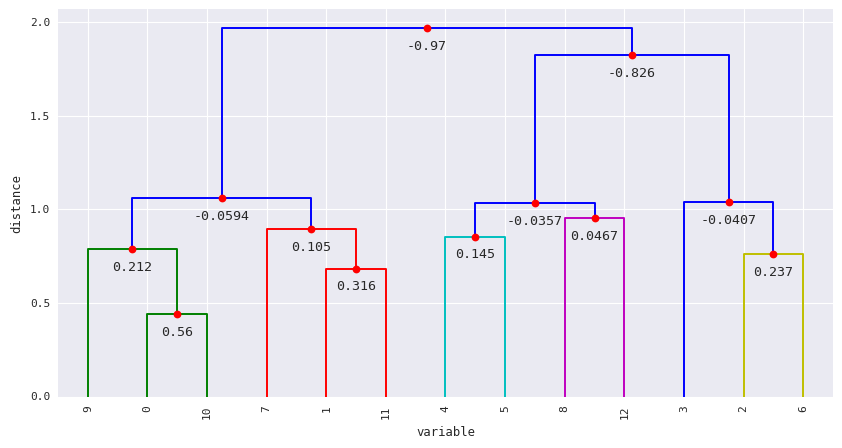
I took @ttnphns advice and used a hierarchical clustering algorithm to cluster by correlation (I believe the algorithm is using a distance metric of 1-Pearson correlation). I obtained a dendrogram as follows (actual Pearson correlation showing at the red dots):
which makes sense when comparing heat map with the dendrogram. For instance variable 0 and 10 have the highest correlation (darkest red); then variable 9 should be added to the cluster (next highest correlation with the 0 and 9).


and filtered out insignificantly correlated variablesWhy did you do that? $\endgroup$