4
$\begingroup$

Are there any (nontrivial) lower bounds on the KL-divergence between two densities? Informally, I am trying to study problems where $f$ is some target density, and I want to show that if $g$ is chosen "poorly", then $KL(f\Vert g)$ must be large. Examples of "poor" behaviour could include different means, moments, etc.

Harder question: Any lower bounds on the KL-divergence between two mixture models (e.g. mixture of gaussians)? For example, a lower bound in terms of the component mixtures.

The only bound I have found is equation (19) in this paper, which unfortunately doesn't seem to help.

$\endgroup$

2 Answers 2

3
$\begingroup$

$\mbox{KL}(f||g)\geq 0$. But seriously, this is actually a really hard problem. Relevant to this topic is the area of Large Deviations Theory, specifically Rate Functions. You'll find a compendum of bounds here for example:

https://en.wikipedia.org/wiki/Inequalities_in_information_theory#Lower_bounds_for_the_Kullback.E2.80.93Leibler_divergence

with Kullback's Inequality being one such bound. The issue is always figuring out how the heck to calculate the rate function.

A slightly non-trivial bound is Pinsker's inequality, which says that total variation can be used to bound KL from belowi, but this is hardly ever tight.

$\endgroup$
1
  • $\begingroup$ Do you have any explanation for why this is so hard? To clarify, you can make assumptions about the densities. $\endgroup$
    – JohnA
    Commented Nov 10, 2017 at 23:01
1
$\begingroup$

I derived a lower bound which only depends on moments (e.g. mean and variance).

Even if the true distribution is unkown, we can calculate the lower bound (approximation) of the KL-divergence using only the expected value and the variance of a function we choose.

Please see Theorem 1 in the following paper.

https://arxiv.org/abs/1907.00288

URL of a sample code for this paper is

https://github.com/nissy220/KL_divergence

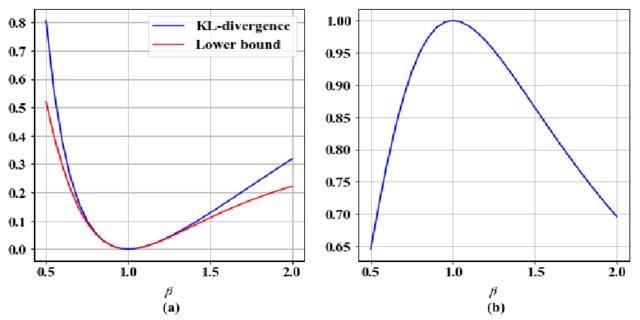
Please confirm the results. In the left graph, the red line is the result of our lower bound and the blue line is the KL-divergence for the normal distribution.

In the left graph, the red line is the result of our lower bound and the blue line is the KL-divergence for the normal distribution.

The right graph displays the ratio.

$\endgroup$

Your Answer

By clicking “Post Your Answer”, you agree to our terms of service and acknowledge you have read our privacy policy.

Not the answer you're looking for? Browse other questions tagged or ask your own question.