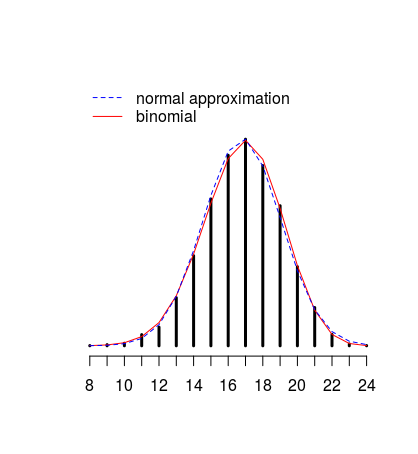
Your question is not totally clear, but from what I understand you are drawing samples of size $n=24$ from the population where there is $70\%$ apples, so probability of drawing apple is $p=0.7$. The results can be described using binomial distribution. You are drawing $5000$ samples, each from binomial distribution, so their distribution is obviously binomial. We can approximate the results using normal distribution, but normal distribution is obviously not the correct distribution in here, as this is a discrete data, while normal distribution is a distribution for continuous values.
We do not need normal approximation in here at all, but if you want to know the variance, then we know that variance of binomial distribution is $np(1-p)$. Standard deviation is a square root of it.
You can easily verify this by simulation, where we sample $5000$ values from the binomial distribution with parameters $n=24$ and $p=0.7$. The true binomial distribution function is drawn in red and the normal approximation in blue. As you can see, in this case normal approximation is very close to binomial and the variance calculated from the variance formula for binomial distribution is correct.
set.seed(123)

x <- rbinom(5000, size = 24, prob = 0.7)
tab <- prop.table(table(x))

plot(tab) # the code was simplified
lines(8:24, dbinom(8:24, size = 24, prob = 0.7), col = "red")
lines(8:24, dnorm(8:24, mean = 24*0.7, sd = sqrt(24*0.7*(1-0.7))),
      col = "blue", lty = 2)


