0
$\begingroup$

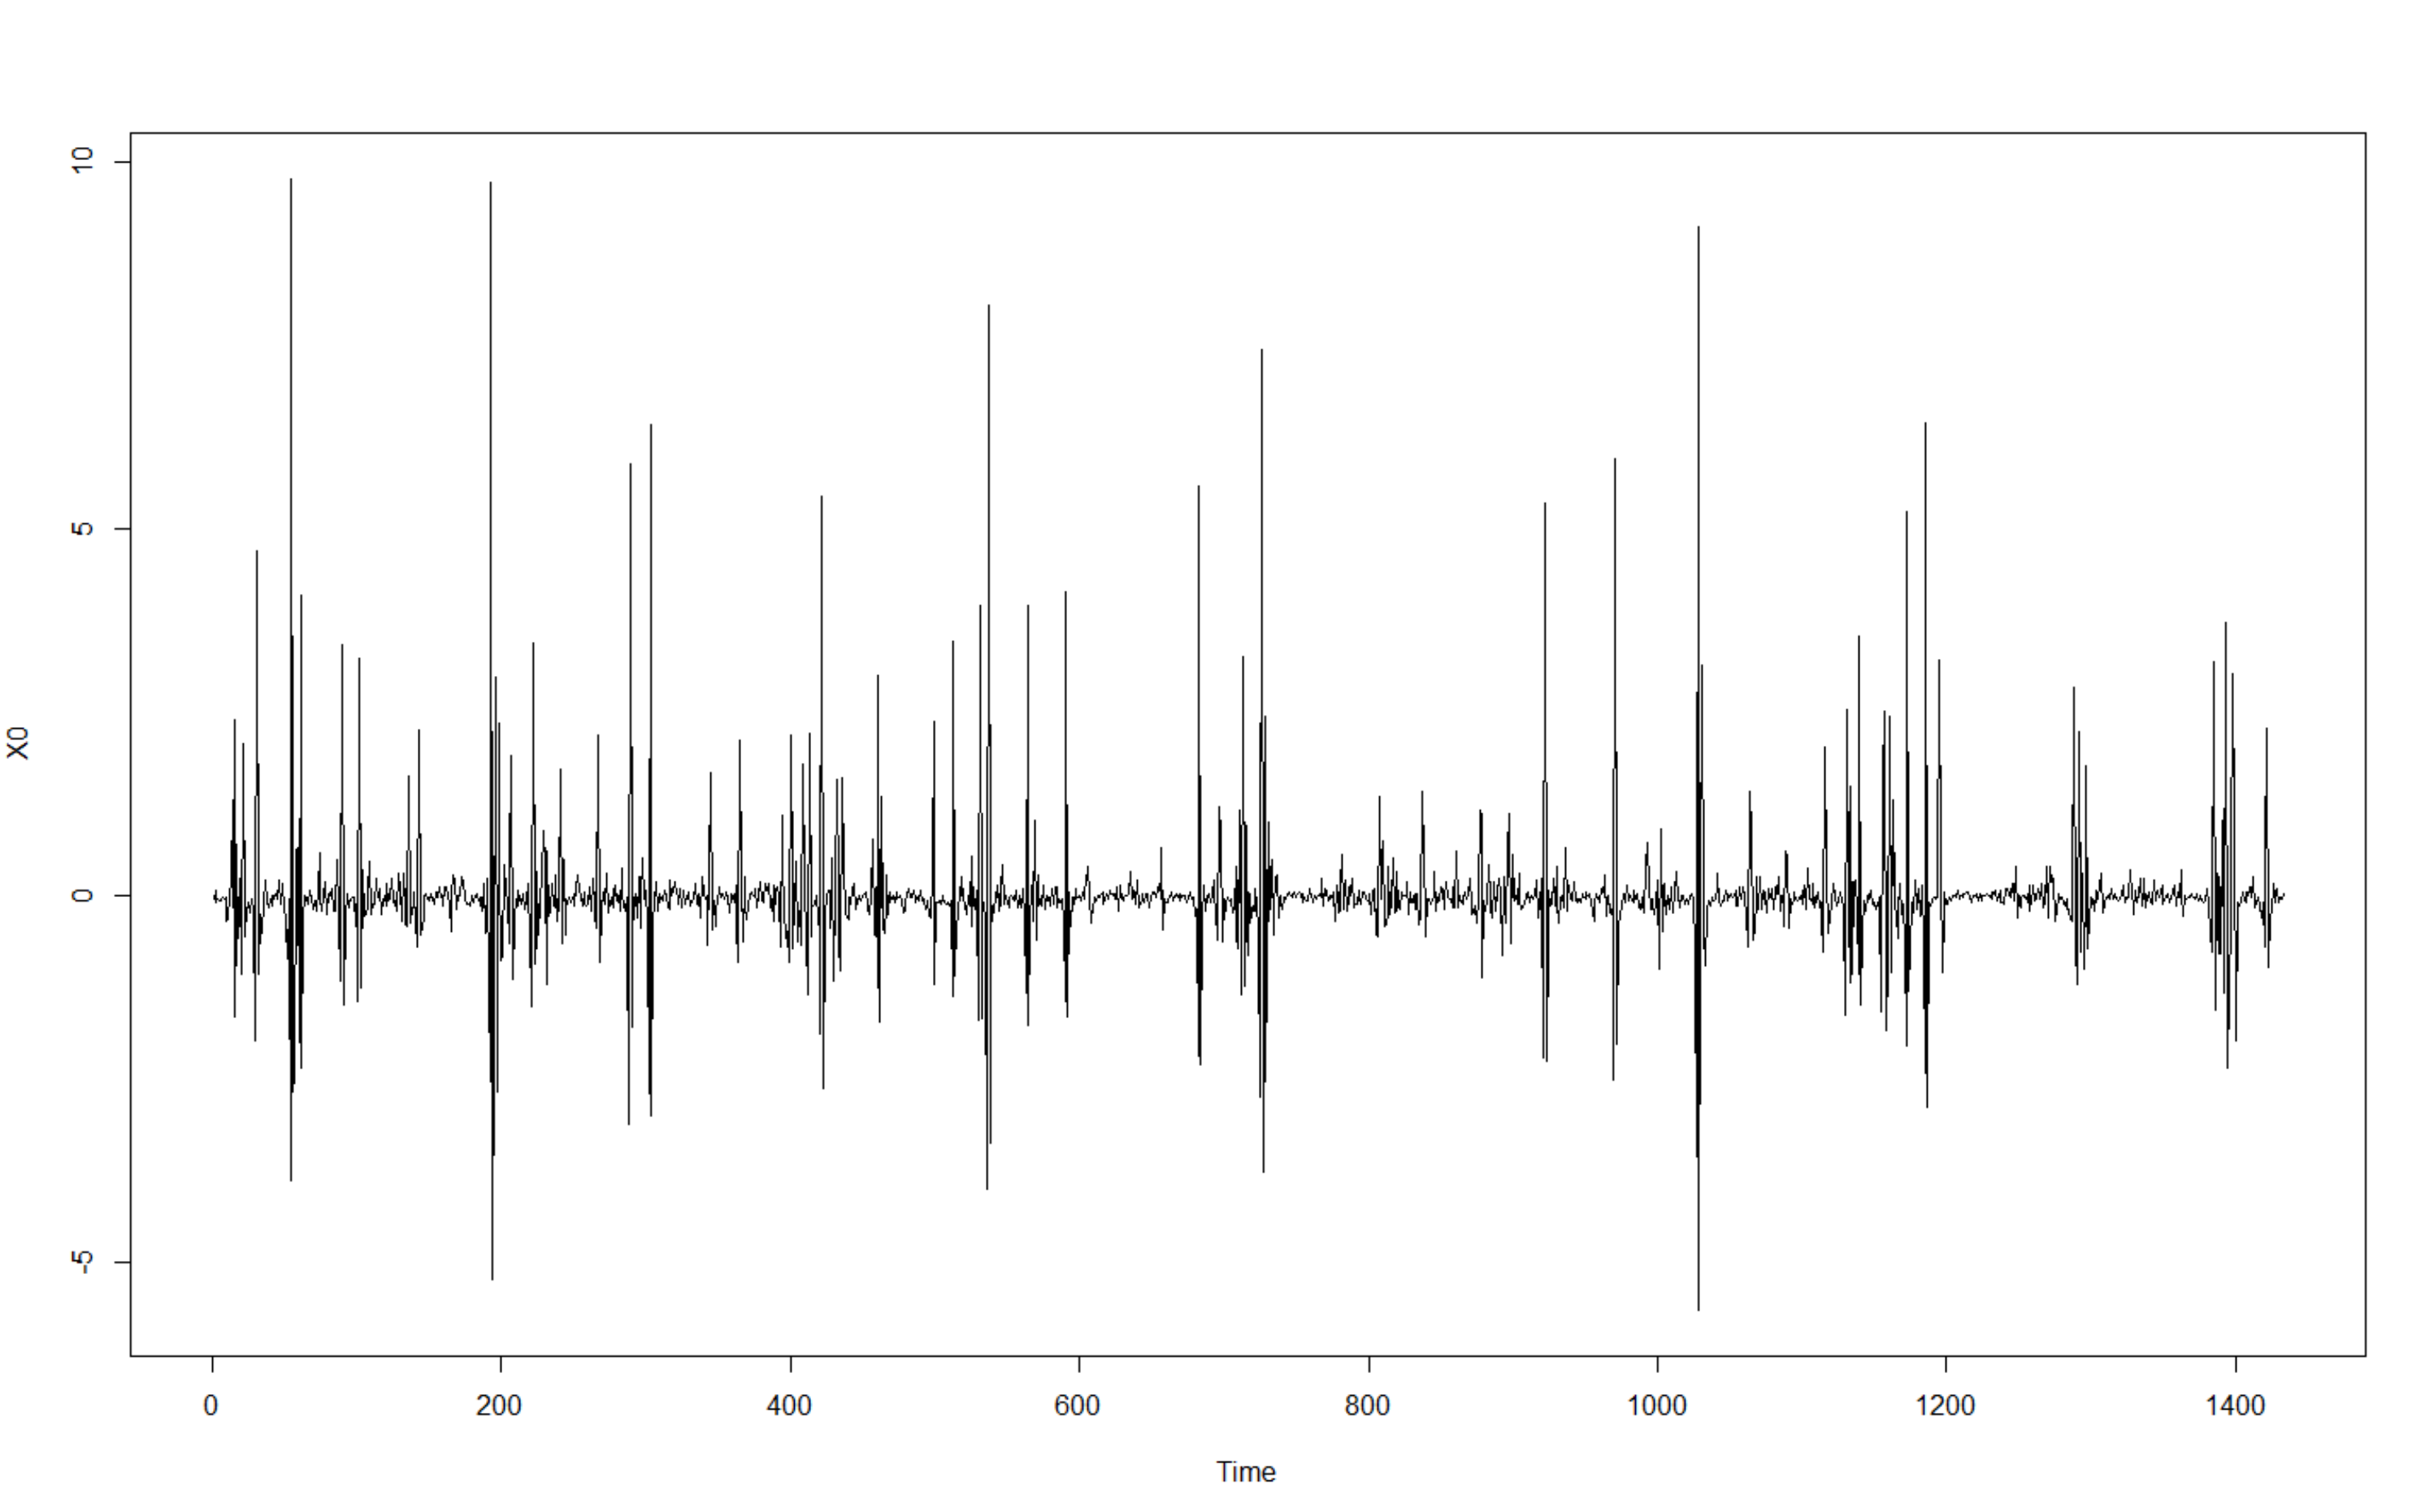
I've been working on fitting a time series generated from an indicator in stock market, whose frequency is 1 minute and length is 1433. This series is stationary, proved by many stationarity tests. The graph of this series lies below. enter image description here
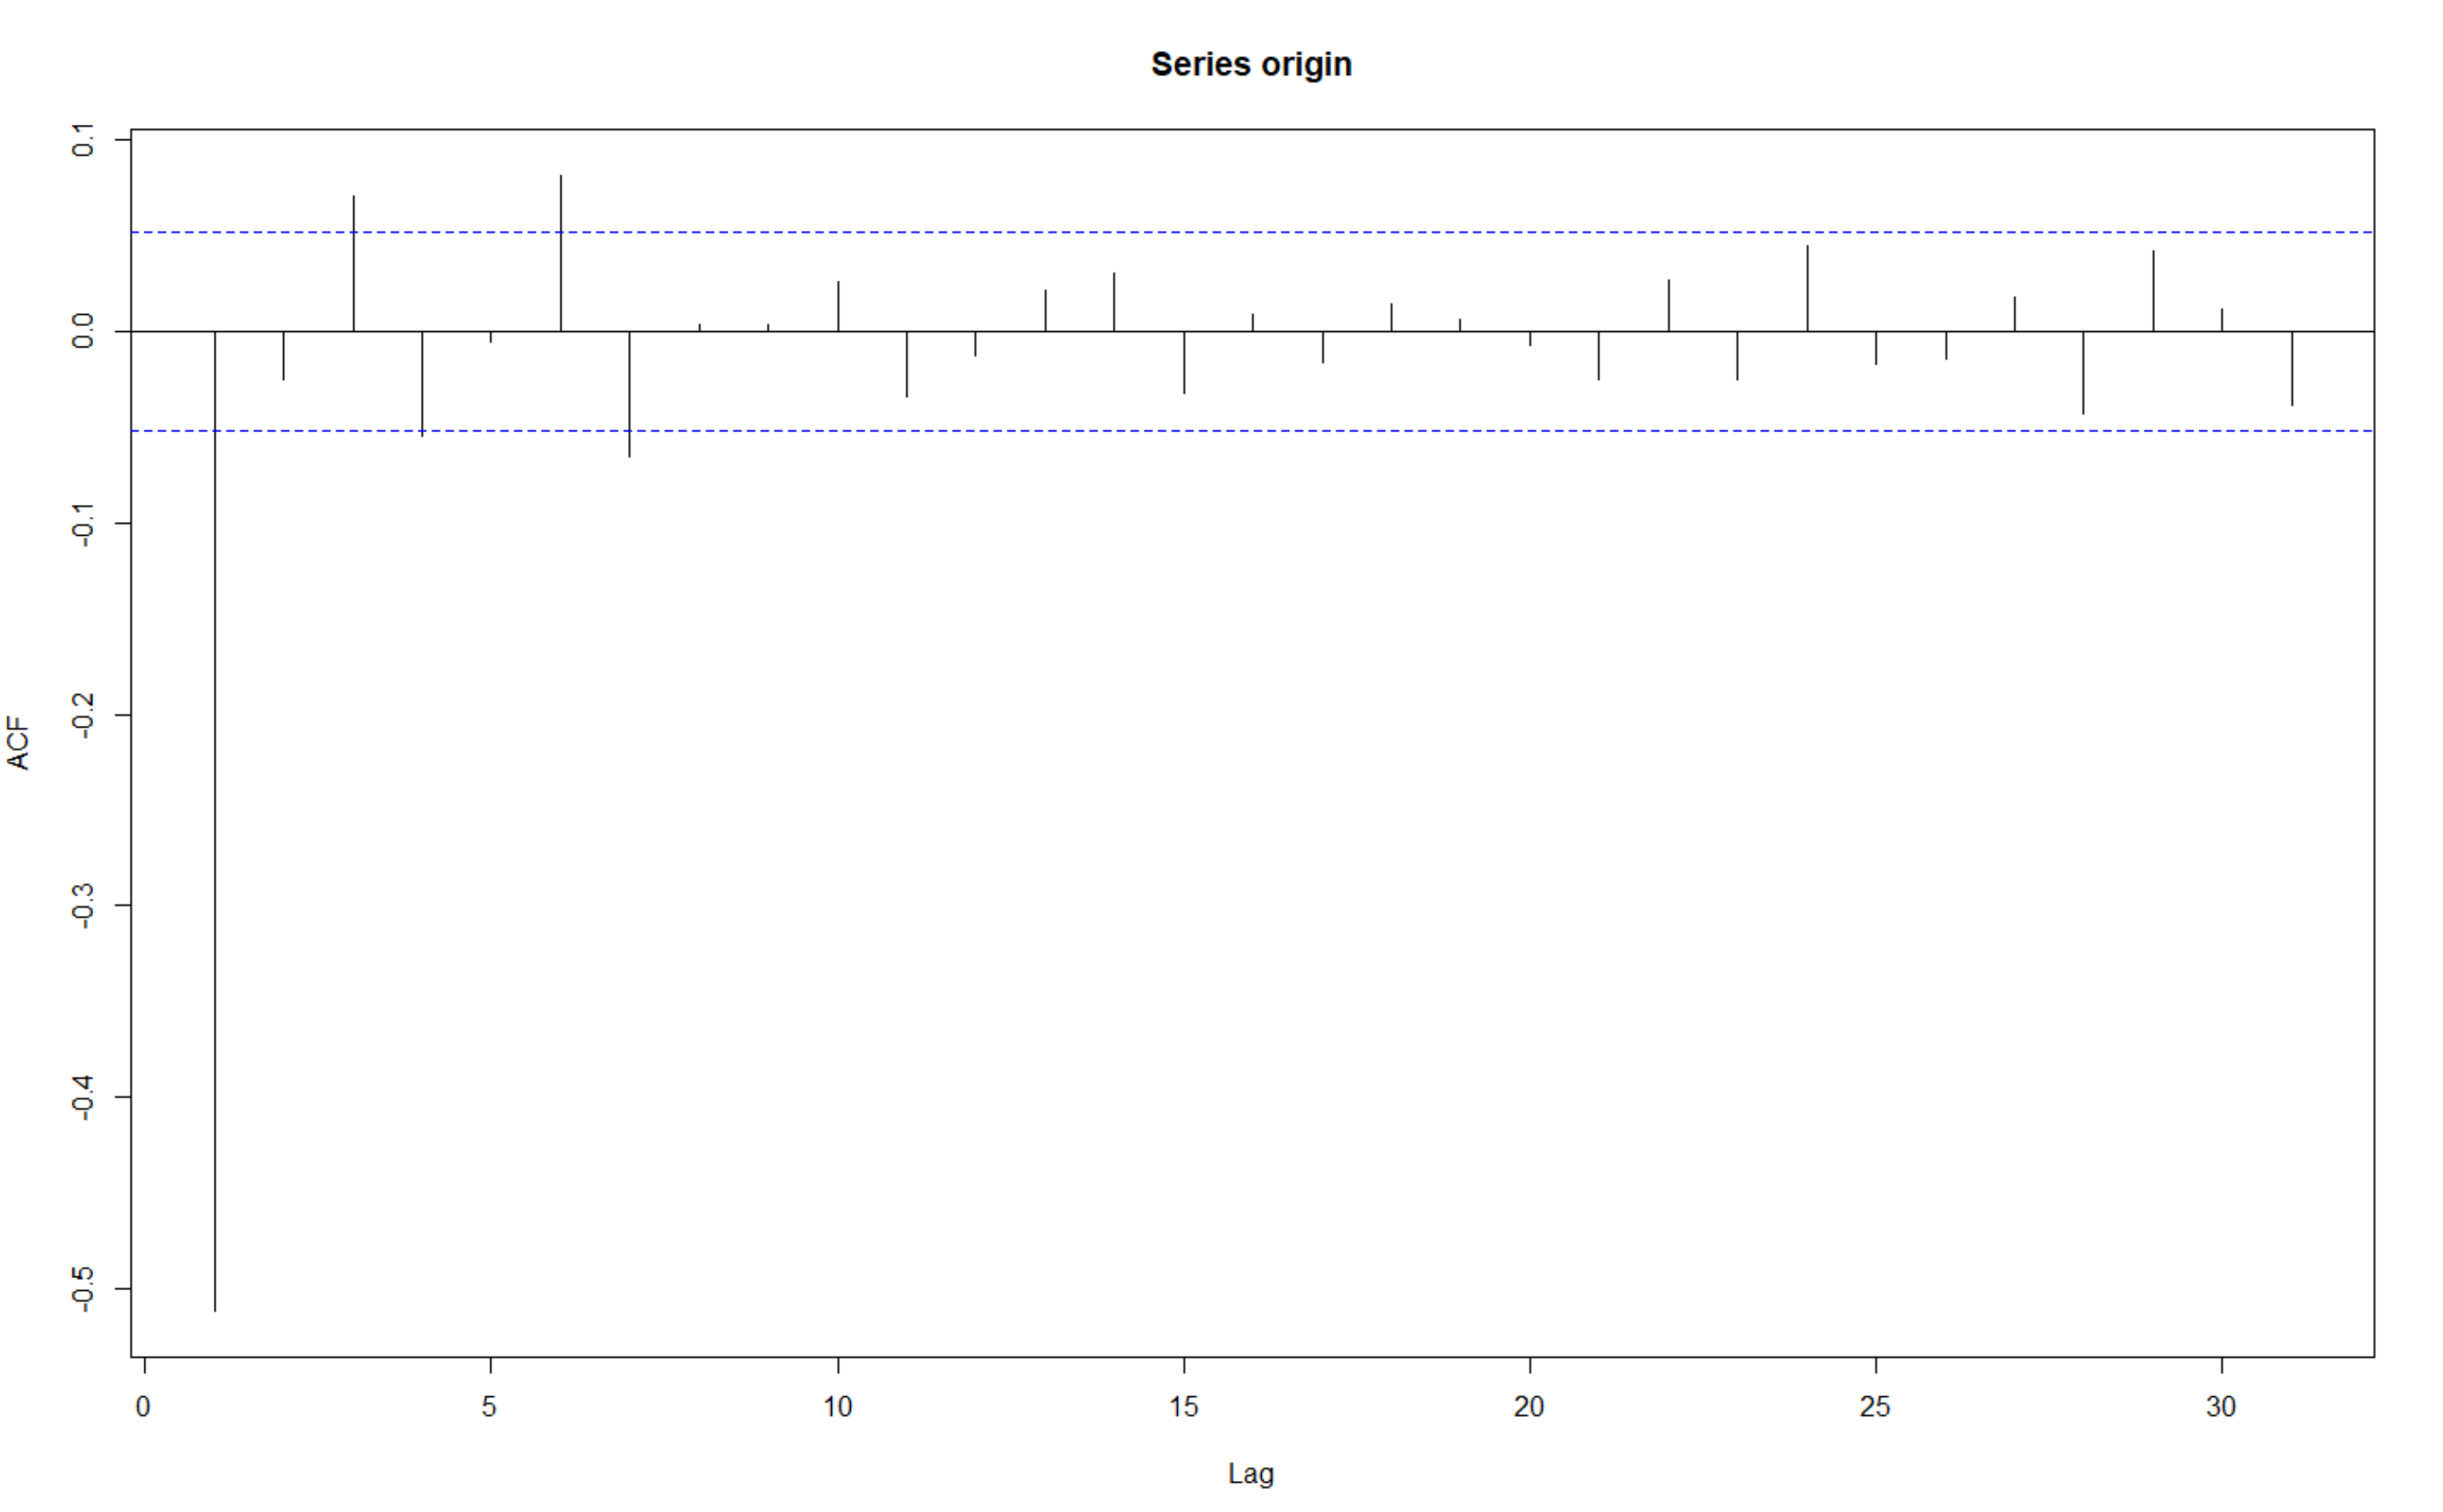
However, I faced great difficulty fitting this time series, though it passed neither Ljung-Box test nor Box-Pierce test, and its autocorrelation is indicated by the graph below.

enter image description here

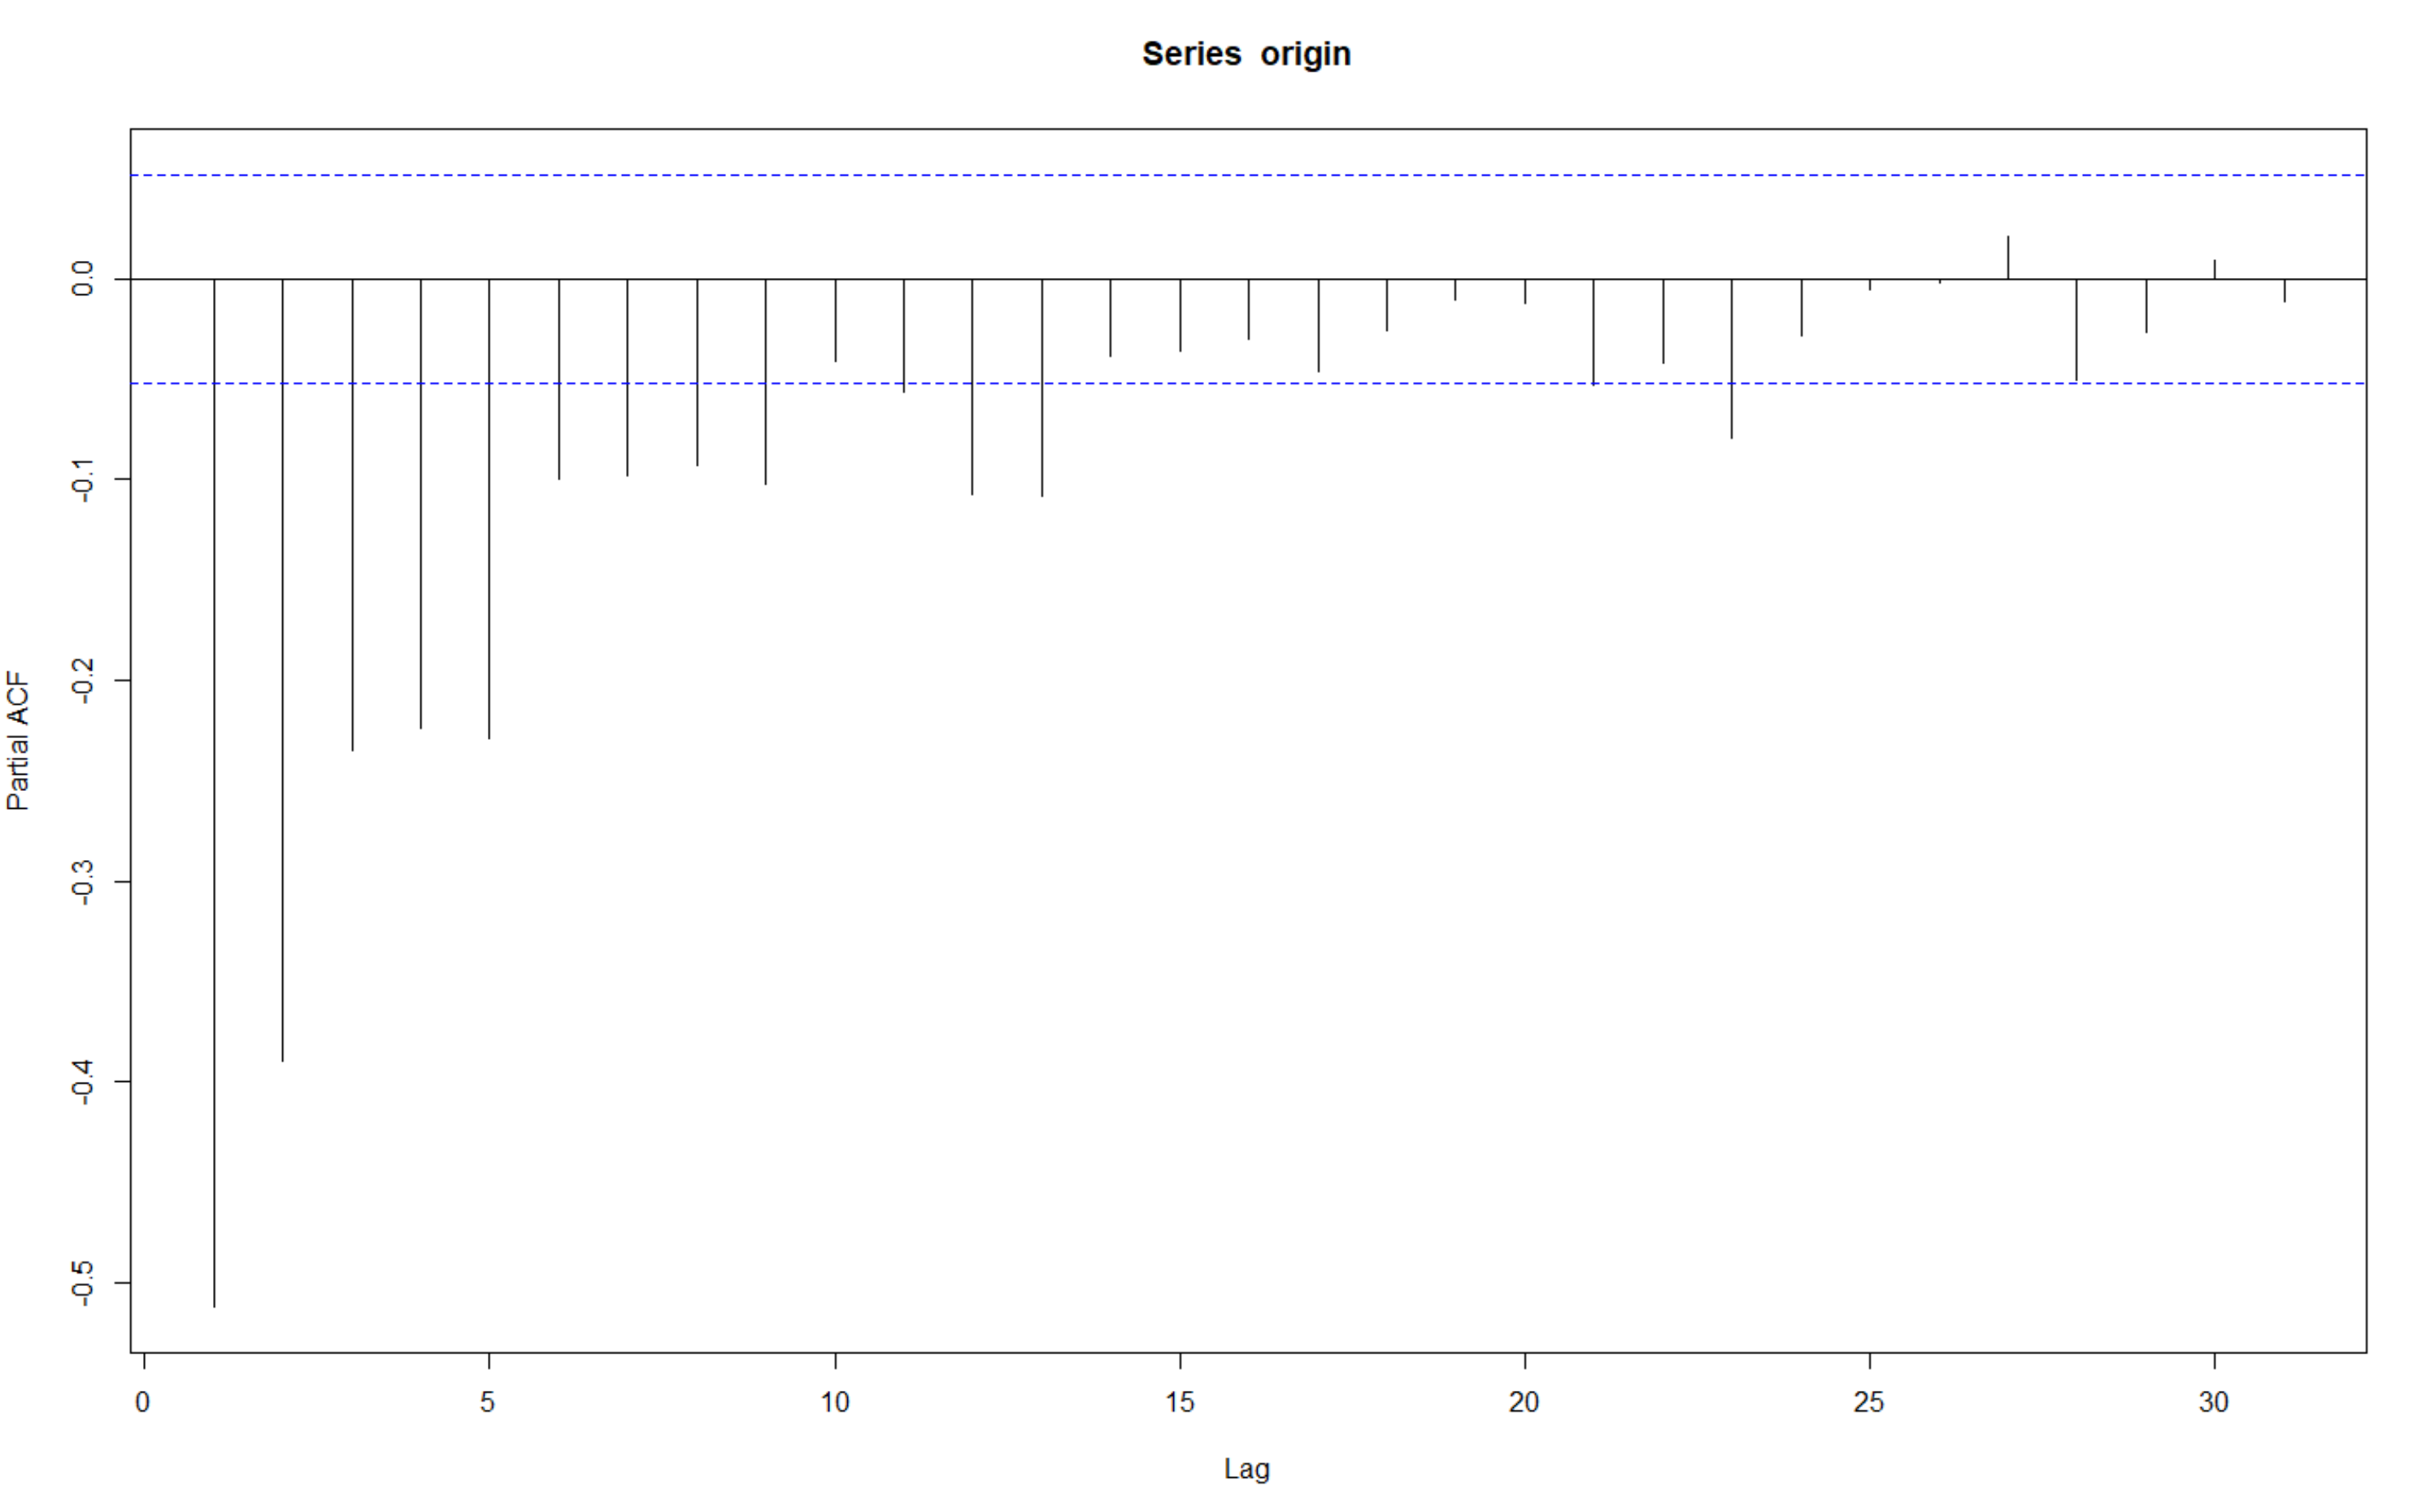
And its partial autocorrelation is like this.

enter image description here

I've tried to fit this time series by ARIMA, whose arguments were chosen by both EACF and iterative process finding the suitable AIC. but the results were not pleasant at all.

I also made attempt by using Kalman filter. Since I haven't learnt much on state space model, I tuned the parameters due to my intuition and the mathematical logic beneath the series. The result was good...But then I got stuck when trying to forecast the series 1-step afterwards without observation...

I wonder if there is anyone who can help me on this issue... Many thanks since it has troubled me for a long time...

$\endgroup$
4
  • 1
    $\begingroup$ The autocorrelation is relatively weak, which implies that there is a strong exogenous influence on the series (not at all uncommon in stock market data). It's difficult to tell without seeing the actual undifferenced series but my guess is that you need to introduce exogenous input and give it another go with ARMAX or neural network autoregression. I would advise you to avoid state space models if you're not well familiar with them. $\endgroup$
    – Digio
    Commented Dec 25, 2017 at 9:33
  • $\begingroup$ The variance in your plot seems to be sequentially dependent, so maybe you can try to model your time series taking this feature of the data into account, for instance using a GARCH model. A GARCH is stationary, but exhibits local variance irregularities that depend on the immediate past. $\endgroup$
    – Jeremias K
    Commented Dec 25, 2017 at 17:40
  • $\begingroup$ @JeremiasK Thanks for help, in order to use GARCH model, I did a Mcleod Li test beforehand in R, the plot showed significance in all lags, but I've seen somewhere before that the series should pass Ljung-Box test, whose null hypothesis will be rejected by this series. So I wonder whether this saying is accurate or not? Or I may just use GARCH model and directly go on? $\endgroup$ Commented Dec 26, 2017 at 2:36
  • $\begingroup$ @Digio I've tried neural network autoregression, the output was optimistic, yet I'd like to find other ways figuring out the model. ARMAX is a good choice, but I'm not quite sure about finding the precise exogenous input...Could you please give me some advice? $\endgroup$ Commented Dec 26, 2017 at 2:44

1 Answer 1

1
$\begingroup$

Exogenous deterministic input can be empirically identified but not explained by Intervention Detection procedures. See here http://docplayer.net/12080848-Outliers-level-shifts-and-variance-changes-in-time-series.html . The analytical problem/opportunity is to simultaneously form/identify the ARIMA structure and the to be found X structure while verifying constant error variance and constant model parameters over time. This can be accomplished by running a tournament based upon alternative pathing.

$\endgroup$

Your Answer

By clicking “Post Your Answer”, you agree to our terms of service and acknowledge you have read our privacy policy.

Not the answer you're looking for? Browse other questions tagged or ask your own question.