1
$\begingroup$

I have run a glm to look at the effects of several environmental variables (x variables) on the numbers of bacteria in a soil sample (y variable):

sludgemodel <- glm(cfu.g ~ days + pH + temperature, family = gaussian (link=identity),
                   na.action = na.exclude, data = sludgeqpcr)

I then plotted the model to check the model assumptions:

plot(sludgemodel)

The plots all look okay except the residuals vs fitted plot which does not have a random distribution but more of a curved distribution.

Should I transform the data or use a different error/link function? I am very new to R and statistics so advice would be appreciated.

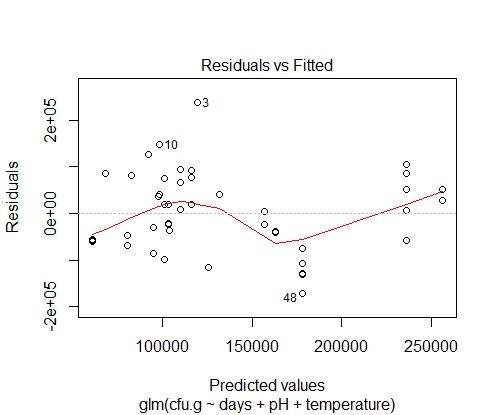
residuals v fitted plot

$\endgroup$
2
  • 1
    $\begingroup$ What is "cfu.g"? $\endgroup$ Commented Jan 4, 2018 at 16:41
  • $\begingroup$ It is my dependent (y) variable. It stands for colony forming units per gram, it is a measure of the number of E.coli cells present in my sample. $\endgroup$
    – LC710
    Commented Jan 5, 2018 at 17:29

3 Answers 3

2
$\begingroup$
  1. Note that, even though you use the glm function, you are fitting a standard linear model (lm) here

  2. It looks as if you are not fitting the right functional form. First, plot res vs. predictors, and then try adding other polynomial terms (e.g. I(pH^2), or sqrt(pH)) or interactions, e.g. pH*temperature, depending on what you see.

$\endgroup$
1
$\begingroup$

Before I fitted more complicated models I would want to:

Re-plot the values with some jitter to eliminate the over-printing which obscures the visual impression.

Ask why there are so many values with the same predicted and observed (hence residual) value at the extreme left of the plot which is virtually forcing the downward turn at the extreme left.

Wonder whether the up-turn on the right is an artefact of the uneven spacing of the predicted values. If any of your predictor variables is inherently continuous but you have used it as categorical then I would revert to continuous and re-fit and re-plot.

$\endgroup$
0
$\begingroup$

You might want to try fitting a Generalized Additive Model (GAM) instead, which does not assume that the data follow any specific parametric (functional) form.

GAMs are a kind of smoothing technique that tries to find curve that capture important variation in the data.

An excellent package in R for this purpose is mgcv. There are many different basis functions to choose from, though the general consensus is to use the one with the best MSE performance, which happens to be a thin-plate smooth (bs = "tp" in mgcv). An alternative is to look to the literature to see what kinds of basis functions have been implemented on the data that you speak of. My advice would be to try fitting a cubic or P-spline smooth in addition to thin-plate.

$\endgroup$

Your Answer

By clicking “Post Your Answer”, you agree to our terms of service and acknowledge you have read our privacy policy.

Not the answer you're looking for? Browse other questions tagged or ask your own question.