1
$\begingroup$

I have a data set of $(X_n, t_n)$ that I am doing a ridge regression on.

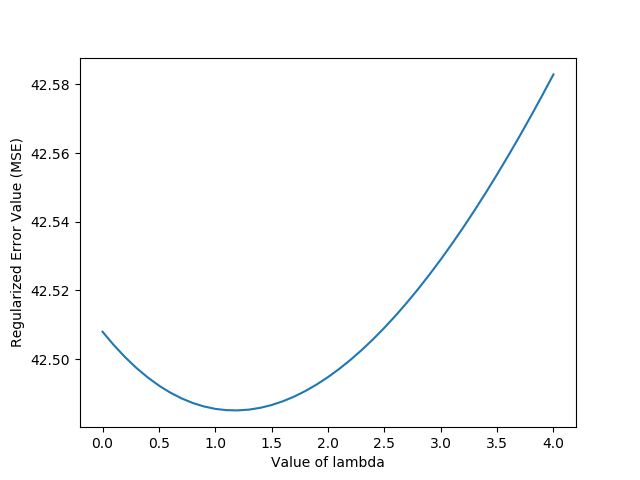
I am also doing $10$ fold cross validation to fine tune the value of $\lambda$ for values from $0$ to $4.0$ in $0.1$ step increments. However, after I did the cross validation and plotted the values of $\lambda$ against the ridge error function: $\sum_{n=1}^N(t_n-w^TX_n)^2 + \frac{\lambda}{2}||w||^2$, I got this curve:

enter image description here

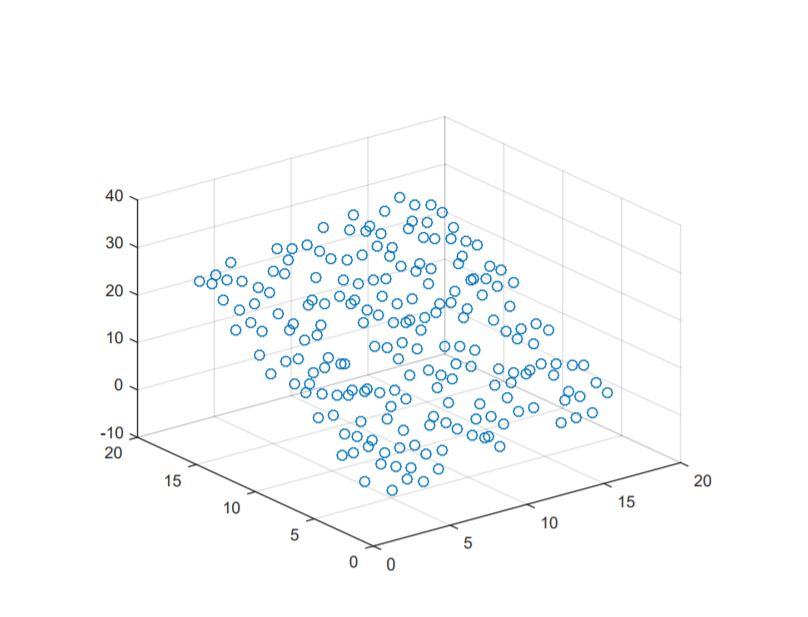
I plotted a scatter plot of the points ($X_n$ is in $\mathbb{R}^2$) and the points looked VERY close to all lying on the same plane:

enter image description here

Could it really be that this is how the error varies as $\lambda$ varies or is there something wrong in my implementation?

$\endgroup$
2
  • 1
    $\begingroup$ (1) The first plot clearly is not linear, although it may be approximately so. (2) What does the second plot show? Without labels on the axes or a description, it's not giving us much information. $\endgroup$
    – whuber
    Commented Jan 12, 2018 at 21:40
  • $\begingroup$ @whuber, (2) on the the bottom plane (20x20), it represents the values of both features in the vector $X_i$ and the $z$ value corresponds to $t_n$. $\endgroup$ Commented Jan 12, 2018 at 21:46

1 Answer 1

2
$\begingroup$

I found out what I was doing wrong. After I calculate the coefficients of the regression $w$, I was calculating the MSE of that prediction wrongly, meaning I was adding the term $+\frac{\lambda}{2}||w||^2$ while calculating the MSE in the end, when this term is only needed when calculating $w$ only!

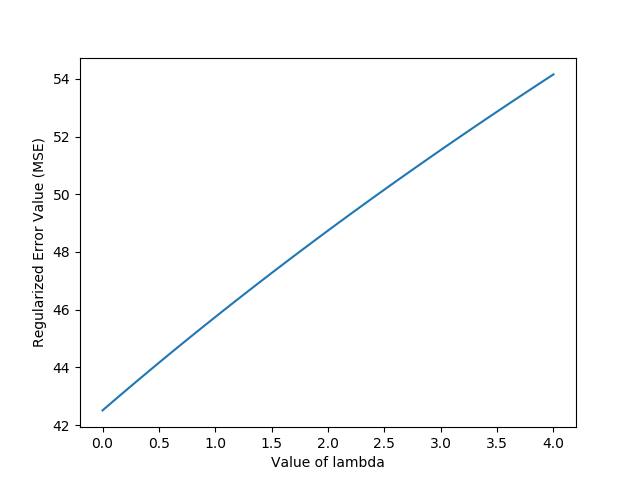
I simply changed the MSE calculation to $\sum_{n=1}^N (t_n-w^TX_n)^2$ and I got this curve which makes more sense:

enter image description here

$\endgroup$

Your Answer

By clicking “Post Your Answer”, you agree to our terms of service and acknowledge you have read our privacy policy.

Not the answer you're looking for? Browse other questions tagged or ask your own question.