0
$\begingroup$

I have fitted a DCC GARCH model to my multivariate financial returns data. Now, I need to compute the time-varying conditional correlation matrix by using the standardized residuals obtained from the DCC-GARCH estimation. Here, the problem is I do not know how to compute conditional correlation matrix by using standardized residuals.

Below is my reproducible code:

load libraries
library(rugarch)
library(rmgarch)
data(dji30retw)
Dat = dji30retw[, 1:8, drop = FALSE]
uspec = ugarchspec(mean.model = list(armaOrder = c(0,0)), variance.model = list(garchOrder = c(1,1), model = "eGARCH"), distribution.model = "norm")
spec1 = dccspec(uspec = multispec(replicate(8, uspec)), dccOrder = c(1,1),  distribution = "mvnorm")
fit1 = dccfit(spec1, data = Dat)
print(fit1)

My question: Is it possible to obtain the time-varying conditional correlation matrix as well as variance of the returns, by using standardized residuals obtained from the DCC-GARCH estimation? I have tried the following code without residuals, but not sure whether it is correct or not:

r1=rcor(fit1, type="cor")

Kindly help me to get the time-varying correlation matrix by using the standardized residuals. I also need help to obtain the variances of each individual returns.

A kind help will be highly appreciated.

Thanks in advance.

$\endgroup$
1
  • $\begingroup$ Thank you very much. Previously, Your excellent suggestion solved my problem. But, I have one more query like individual plot command plotting the DCC between the two variables as follows plot(rcor(fit1, type="R")['AA','CVX',], type='l'), is there any command to obtain the DCC coefficients between 'AA' and 'CVX' throughout the history? I am able to obtain the correlation matrix, but I need correlation coefficients between the particular variables. Thank you very much for your help. $\endgroup$ Commented Nov 25, 2019 at 10:52

1 Answer 1

1
$\begingroup$

From the documentation pp. 18-19, it looks like rcor is indeed the correct method to use:

rcor signature(object = "DCCfit"): The fitted dynamic conditional correlation array given additional argument ‘type’ (either “R” for the correlation else will return the Q matrix). The third dimension label of the array gives the time index (from which it is then possible to construct pairwise xts objects for example).

But you're passing in the wrong parameter. The major diagonal of any correlation matrix should consist of 1s, which is clearly not the case in your example. What you are actually returning is the Q-matrix.

To extract the fitted conditional correlation matrix you should pass in type="R".

As an example, to extract the conditional correlations on the last day of your data (11 Aug 1989), you may use

rcor(fit1, type="R")[,,'1989-08-11']

which returns

       AA       AXP        BA       BAC         C       CAT       CVX        DD
AA  1.0000000 0.3800385 0.3389175 0.2814159 0.3167304 0.5265918 0.3281160 0.4972934
AXP 0.3800385 1.0000000 0.3998785 0.4866435 0.5451798 0.3519354 0.2795902 0.4127131
BA  0.3389175 0.3998785 1.0000000 0.3218324 0.2764014 0.3407582 0.2468411 0.4156071
BAC 0.2814159 0.4866435 0.3218324 1.0000000 0.4760374 0.2468499 0.2632407 0.3403304
C   0.3167304 0.5451798 0.2764014 0.4760374 1.0000000 0.2916486 0.1789378 0.2897223
CAT 0.5265918 0.3519354 0.3407582 0.2468499 0.2916486 1.0000000 0.3229722 0.4615317
CVX 0.3281160 0.2795902 0.2468411 0.2632407 0.1789378 0.3229722 1.0000000 0.4137654
DD  0.4972934 0.4127131 0.4156071 0.3403304 0.2897223 0.4615317 0.4137654 1.0000000

The conditional variances are on the diagonal of the matrix returned by rcov. For example, on the same day the conditional variances are:

diag(rcov(fit1)[,,'1989-08-11'])

which returns

          AA          AXP           BA          BAC            C          CAT          CVX           DD 
0.0014763300 0.0007408490 0.0011760327 0.0012917933 0.0017316865 0.0013564631 0.0008630912 0.0006962063 

You should experiment with indexing the results of the rcor and rcov methods. And try plotting the numbers to get a feel for them.

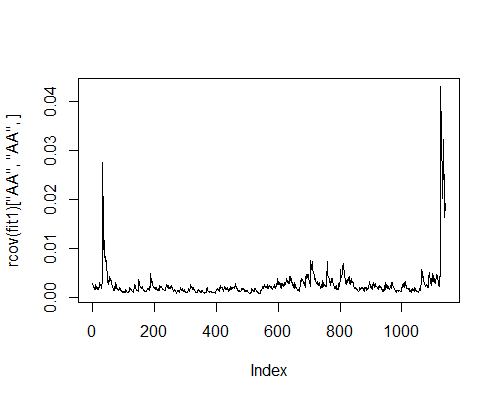
For example, to plot the conditional variance throughout history of AA, you can run

plot(rcov(fit1)['AA','AA',], type='l')

enter image description here

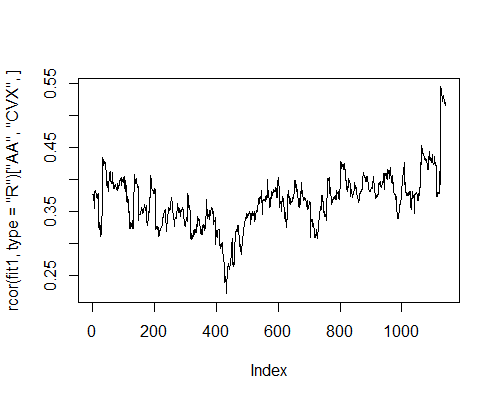
And to plot the conditional correlation between AA and CVX throughout history, you can run

plot(rcor(fit1, type="R")['AA','CVX',], type='l')

enter image description here

$\endgroup$
1
  • $\begingroup$ Ok. I got my answer. But, i want to combine 2 DCC-plots into 1 plot. Please help to combine 2 DCC plots into 1. $\endgroup$ Commented May 6, 2018 at 8:18

Your Answer

By clicking “Post Your Answer”, you agree to our terms of service and acknowledge you have read our privacy policy.

Not the answer you're looking for? Browse other questions tagged or ask your own question.