70
$\begingroup$

Consider a good old regression problem with $p$ predictors and sample size $n$. The usual wisdom is that OLS estimator will overfit and will generally be outperformed by the ridge regression estimator: $$\hat\beta = (X^\top X + \lambda I)^{-1}X^\top y.$$ It is standard to use cross-validation to find an optimal regularization parameter $\lambda$. Here I use 10-fold CV. Clarification update: when $n<p$, by "OLS estimator" I understand "minimum-norm OLS estimator" given by $$\hat\beta_\text{OLS} = (X^\top X)^+X^\top y = X^+ y.$$

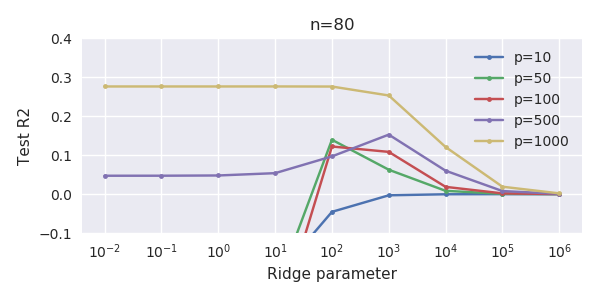
I have a dataset with $n=80$ and $p>1000$. All predictors are standardized, and there are quite a few that (alone) can do a good job in predicting $y$. If I randomly select a small-ish, say $p=50<n$, number of predictors, I get a reasonable CV curve: large values of $\lambda$ yield zero R-squared, small values of $\lambda$ yield negative R-squared (because of overfitting) and there is some maximum in between. For $p=100>n$ the curve looks similar. However, for $p$ much larger than that, e.g. $p=1000$, I do not get any maximum at all: the curve plateaus, meaning that OLS with $\lambda\to 0$ performs as good as ridge regression with optimal $\lambda$.

enter image description here

How is it possible and what does it say about my dataset? Am I missing something obvious or is it indeed counter-intuitive? How can there be any qualitative difference between $p=100$ and $p=1000$ given that both are larger than $n$?

Under what conditions does minimal-norm OLS solution for $n<p$ not overfit?


Update: There was some disbelief in the comments, so here is a reproducible example using glmnet. I use Python but R users will easily adapt the code.

%matplotlib notebook

import numpy as np
import pylab as plt
import seaborn as sns; sns.set()

import glmnet_python    # from https://web.stanford.edu/~hastie/glmnet_python/
from cvglmnet import cvglmnet; from cvglmnetPlot import cvglmnetPlot

# 80x1112 data table; first column is y, rest is X. All variables are standardized
mydata = np.loadtxt('../q328630.txt')   # file is here https://pastebin.com/raw/p1cCCYBR
y = mydata[:,:1]
X = mydata[:,1:]

# select p here (try 1000 and 100)
p = 1000

# randomly selecting p variables out of 1111
np.random.seed(42)
X = X[:, np.random.permutation(X.shape[1])[:p]]

fit = cvglmnet(x = X.copy(), y = y.copy(), alpha = 0, standardize = False, intr = False, 
               lambdau=np.array([.0001, .001, .01, .1, 1, 10, 100, 1000, 10000, 100000]))
cvglmnetPlot(fit)
plt.gcf().set_size_inches(6,3)
plt.tight_layout()

enter image description here enter image description here

$\endgroup$
54
  • 2
    $\begingroup$ @DJohnson No kidding. Usual 10-fold CV, meaning each training set has n=72 and each test set has n=8. $\endgroup$
    – amoeba
    Commented Feb 14, 2018 at 18:18
  • 2
    $\begingroup$ That is far from a usual CV. Given that how could one expect anything like a detectable result? $\endgroup$
    – user78229
    Commented Feb 14, 2018 at 19:35
  • 4
    $\begingroup$ @DJohnson I don't understand why are you saying this is far from usual. This is what 10-fold CV is. $\endgroup$
    – amoeba
    Commented Feb 14, 2018 at 22:13
  • 2
    $\begingroup$ @seanv507 I see. Well, I suggest to define "solution with lambda=0" as "minimal-norm solution with lambda=0". I guess my question can be reformulated as follows: Under what conditions will minimal-norm OLS solution with n<p overfit vs. not overfit? $\endgroup$
    – amoeba
    Commented Feb 16, 2018 at 8:03
  • 3
    $\begingroup$ @amoeba: Thank you for this question. It has been extremely instructive and interesting so far. $\endgroup$
    – usεr11852
    Commented Feb 16, 2018 at 22:51

6 Answers 6

39
+100
$\begingroup$

A natural regularization happens because of the presence of many small components in the theoretical PCA of $x$. These small components are implicitly used to fit the noise using small coefficients. When using minimum norm OLS, you fit the noise with many small independent components and this has a regularizing effect equivalent to Ridge regularization. This regularization is often too strong, and it is possible to compensate it using "anti-regularization" know as negative Ridge. In that case, you will see the minimum of the MSE curve appears for negative values of $\lambda$.

By theoretical PCA, I mean:

Let $x\sim N(0,\Sigma)$ a multivariate normal distribution. There is a linear isometry $f$ such as $u=f(x)\sim N(0,D)$ where $D$ is diagonal: the components of $u$ are independent. $D$ is simply obtained by diagonalizing $\Sigma$.

Now the model $y=\beta.x+\epsilon$ can be written $y=f(\beta).f(x)+\epsilon$ (a linear isometry preserves dot product). If you write $\gamma=f(\beta)$, the model can be written $y=\gamma.u+\epsilon$. Furthermore $\|\beta\|=\|\gamma\|$ hence fitting methods like Ridge or minimum norm OLS are perfectly isomorphic: the estimator of $y=\gamma.u+\epsilon$ is the image by $f$ of the estimator of $y=\beta.x+\epsilon$.

Theoretical PCA transforms non independent predictors into independent predictors. It is only loosely related to empirical PCA where you use the empirical covariance matrix (that differs a lot from the theoretical one with small sample size). Theoretical PCA is not practically computable but is only used here to interpret the model in an orthogonal predictor space.

Let's see what happens when we append many small variance independent predictors to a model:

Theorem

Ridge regularization with coefficient $\lambda$ is equivalent (when $p\rightarrow\infty$) to:

  • adding $p$ fake independent predictors (centred and identically distributed) each with variance $\frac{\lambda}{p}$
  • fitting the enriched model with minimum norm OLS estimator
  • keeping only the parameters for the true predictors

(sketch of) Proof

We are going to prove that the cost functions are asymptotically equal. Let's split the model into real and fake predictors: $y=\beta x+\beta'x'+\epsilon$. The cost function of Ridge (for the true predictors) can be written:

$$\mathrm{cost}_\lambda=\|\beta\|^2+\frac{1}{\lambda}\|y-X\beta\|^2$$

When using minimum norm OLS, the response is fitted perfectly: the error term is 0. The cost function is only about the norm of the parameters. It can be split into the true parameters and the fake ones:

$$\mathrm{cost}_{\lambda,p}=\|\beta\|^2+\inf\{\|\beta'\|^2 \mid X'\beta'=y-X\beta\}$$

In the right expression, the minimum norm solution is given by:

$$\beta'=X'^+(y-X\beta )$$

Now using SVD for $X'$:

$$X'=U\Sigma V$$

$$X'^{+}=V^\top\Sigma^{+} U^\top$$

We see that the norm of $\beta'$ essentially depends on the singular values of $X'^+$ that are the reciprocals of the singular values of $X'$. The normalized version of $X'$ is $\sqrt{p/\lambda} X'$. I've looked at literature and singular values of large random matrices are well known. For $p$ and $n$ large enough, minimum $s_\min$ and maximum $s_\max$ singular values are approximated by (see theorem 1.1):

$$s_\min(\sqrt{p/\lambda}X')\approx \sqrt p\left(1-\sqrt{n/p}\right)$$ $$s_\max(\sqrt{p/\lambda}X')\approx \sqrt p \left(1+\sqrt{n/p}\right)$$

Since, for large $p$, $\sqrt{n/p}$ tends towards 0, we can just say that all singular values are approximated by $\sqrt p$. Thus:

$$\|\beta'\|\approx\frac{1}{\sqrt\lambda}\|y-X\beta\|$$

Finally:

$$\mathrm{cost}_{\lambda,p}\approx\|\beta\|^2+\frac{1}{\lambda}\|y-X\beta\|^2=\mathrm{cost}_\lambda$$

Note: it does not matter if you keep the coefficients of the fake predictors in your model. The variance introduced by $\beta'x'$ is $\frac{\lambda}{p}\|\beta'\|^2\approx\frac{1}{p}\|y-X\beta\|^2\approx\frac{n}{p}MSE(\beta)$. Thus you increase your MSE by a factor $1+n/p$ only which tends towards 1 anyway. Somehow you don't need to treat the fake predictors differently than the real ones.

Now, back to @amoeba's data. After applying theoretical PCA to $x$ (assumed to be normal), $x$ is transformed by a linear isometry into a variable $u$ whose components are independent and sorted in decreasing variance order. The problem $y=\beta x+\epsilon$ is equivalent the transformed problem $y=\gamma u+\epsilon$.

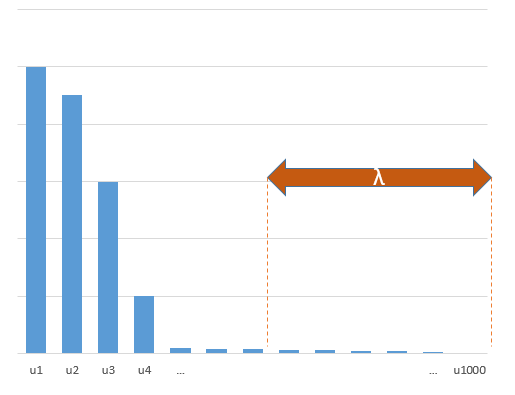
Now imagine the variance of the components look like:

enter image description here

Consider many $p$ of the last components, call the sum of their variance $\lambda$. They each have a variance approximatively equal to $\lambda/p$ and are independent. They play the role of the fake predictors in the theorem.

This fact is clearer in @jonny's model: only the first component of theoretical PCA is correlated to $y$ (it is proportional $\overline{x}$) and has huge variance. All the other components (proportional to $x_i-\overline{x}$) have comparatively very small variance (write the covariance matrix and diagonalize it to see this) and play the role of fake predictors. I calculated that the regularization here corresponds (approx.) to prior $N(0,\frac{1}{p^2})$ on $\gamma_1$ while the true $\gamma_1^2=\frac{1}{p}$. This definitely over-shrinks. This is visible by the fact that the final MSE is much larger than the ideal MSE. The regularization effect is too strong.

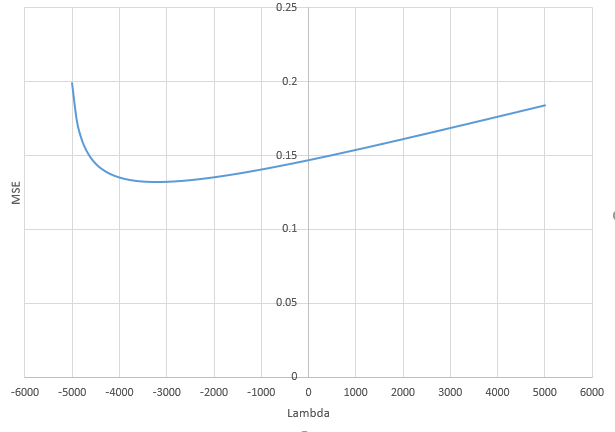
It is sometimes possible to improve this natural regularization by Ridge. First you sometimes need $p$ in the theorem really big (1000, 10000...) to seriously rival Ridge and the finiteness of $p$ is like an imprecision. But it also shows that Ridge is an additional regularization over a naturally existing implicit regularization and can thus have only a very small effect. Sometimes this natural regularization is already too strong and Ridge may not even be an improvement. More than this, it is better to use anti-regularization: Ridge with negative coefficient. This shows MSE for @jonny's model ($p=1000$), using $\lambda\in\mathbb{R}$:

enter image description here

$\endgroup$
40
  • 2
    $\begingroup$ +1 Very nice, thanks for writing this up. I think it's important to clarify that when you say "regularization" you mean $L_2$ (i.e. ridge) regularization. One would hope that lasso or elastic net can behave better and indeed that is what people are using in $n\gg p$ situations. Nobody uses pure ridge in such a setting and the standard advice is to use regularizations enforcing sparsity; so the behaviour of pure ridge might only have an academic interest. Still, it's pretty amazing that we seem to be discovering it here. Why is this not well-known?? $\endgroup$
    – amoeba
    Commented Feb 17, 2018 at 22:02
  • 1
    $\begingroup$ Poorly hard-coded $\lambda$ proportional to $\sigma^2$. Sorry I didn't time for something proper. My main focus was the behaviour of min-norm OLS, to see that it differs from your example and that "some not too bad regularization" on 40 firsts was violently better. $\endgroup$ Commented Feb 19, 2018 at 11:50
  • 3
    $\begingroup$ I think I've understood the mystery: Ridge regularization with coefficient $\lambda$ is equivalent to min-norm OLS adding $p$ fake predictors each with variance $\lambda/p$ (asymptotically for large $p$). In your data and Johny's model it happens without doing anything thanks to lowest variance components from PCA. Now I need time to find a way to explain this clearly... $\endgroup$ Commented Feb 19, 2018 at 21:06
  • 1
    $\begingroup$ I clarified a small point: the coefficients of the fake predictors do not increase the error much (see note at the end of the proof). It's important because in your data/jonny's they are inevitably retained. $\endgroup$ Commented Feb 21, 2018 at 21:03
  • 3
    $\begingroup$ I tried negative Ridge. I can't believe but it works!!! (and not only on Jonny's model...) $\endgroup$ Commented Feb 26, 2018 at 15:10
26
$\begingroup$

Thanks everybody for the great ongoing discussion. The crux of the matter seems to be that minimum-norm OLS is effectively performing shrinkage that is similar to the ridge regression. This seems to occur whenever $p\gg n$. Ironically, adding pure noise predictors can even be used as a very weird form or regularization.


Part I. Demonstration with artificial data and analytical CV

@Jonny (+1) came up with a really simple artificial example that I will slightly adapt here. $X$ of $n\times p$ size and $y$ are generated such that all variables are Gaussian with unit variance, and correlation between each predictor and the response is $\rho$. I will fix $\rho=.2$.

I will use leave-one-out CV because there is analytical expression for the squared error: it is known as PRESS, "predicted sum of squares". $$\text{PRESS} = \sum_i \left( \frac{e_i}{1-H_{ii}}\right)^2,$$ where $e_i$ are residuals $$e = y - \hat y = y - Hy,$$ and $H$ is the hat matrix $$H = X (X^\top X + \lambda I)^{-1} X^\top=U\frac{S^2}{S^2+\lambda} U^\top$$ in terms of SVD $X=USV^\top$. This allows to replicate @Jonny's results without using glmnet and without actually performing cross-validation (I am plotting the ratio of PRESS to the sum of squares of $y$):

enter image description here

This analytical approach allows to compute the limit at $\lambda\to 0$. Simply plugging in $\lambda=0$ into the PRESS formula does not work: when $n<p$ and $\lambda=0$, the residuals are all zero and hat matrix is the identity matrix with ones on the diagonal, meaning that the fractions in the PRESS equation are undefined. But if we compute the limit at $\lambda \to 0$, then it will correspond to the minimum-norm OLS solution with $\lambda=0$.

The trick is to do Taylor expansion of the hat matrix when $\lambda\to 0$: $$H=U\frac{1}{1+\lambda/S^2} U^\top\approx U(1-\lambda/S^2) U^\top = I - \lambda US^{-2}U^\top = I-\lambda G^{-1}.$$ Here I introduced Gram matrix $G=XX^\top = US^2U^\top$.

We are almost done: $$\text{PRESS} = \sum_i\Big( \frac{\lambda [G^{-1}y]_i}{\lambda G^{-1}_{ii}}\Big)^2 = \sum_i\Big( \frac{ [G^{-1}y]_i}{G^{-1}_{ii}}\Big)^2.$$ Lambda got canceled out, so here we have the limiting value. I plotted it with a big black dot on the figure above (on the panels where $p>n$), and it matches perfectly.

Update Feb 21. The above formula is exact, but we can gain some insight by doing further approximations. It looks like $G^{-1}$ has approximately equal values on the diagonal even if $S$ has very unequal values (probably because $U$ mixes up all the eigenvalues pretty well). So for each $i$ we have that $G^{-1}_{ii}\approx \langle S^{-2} \rangle$ where angular brackets denote averaging. Using this approximation, we can rewrite: $$\text{PRESS}\approx \Big\lVert \frac{S^{-2}}{\langle S^{-2} \rangle}U^\top y\Big\rVert^2.$$ This approximation is shown on the figure above with red open circles.

Whether this will be larger or smaller than $\lVert y \rVert^2 = \lVert U^\top y \rVert^2$ depends on the singular values $S$. In this simulation $y$ is correlated with the first PC of $X$ so $U_1^\top y$ is large and all other terms are small. (In my real data, $y$ is also well predicted by the leading PCs.) Now, in the $p\gg n$ case, if the columns of $X$ are sufficiently random, then all singular values will be rather close to each other (rows approximately orthogonal). The "main" term $U_1^\top y$ will be multiplied by a factor less than 1. The terms towards the end will get multiplied by factors larger than 1 but not much larger. Overall the norm decreases. In contrast, in the $p\gtrsim n$ case, there will be some very small singular values. After inversion they will become large factors that will increase the overall norm.

[This argument is very hand-wavy; I hope it can be made more precise.]

As a sanity check, if I swap the order of singular values by S = diag(flipud(diag(S))); then the predicted MSE is above $1$ everywhere on the 2nd and the 3rd panels.

figure('Position', [100 100 1000 300])
ps = [10, 100, 1000];

for pnum = 1:length(ps)
    rng(42)
    n = 80;
    p = ps(pnum);
    rho = .2;
    y = randn(n,1);
    X = repmat(y, [1 p])*rho + randn(n,p)*sqrt(1-rho^2);

    lambdas = exp(-10:.1:20);
    press = zeros(size(lambdas));
    [U,S,V] = svd(X, 'econ');
    % S = diag(flipud(diag(S)));   % sanity check

    for i = 1:length(lambdas)
        H = U * diag(diag(S).^2./(diag(S).^2 + lambdas(i))) * U';
        e = y - H*y;
        press(i) = sum((e ./ (1-diag(H))).^2);
    end

    subplot(1, length(ps), pnum)
    plot(log(lambdas), press/sum(y.^2))
    hold on
    title(['p = ' num2str(p)])
    plot(xlim, [1 1], 'k--')

    if p > n
        Ginv = U * diag(diag(S).^-2) * U';
        press0 = sum((Ginv*y ./ diag(Ginv)).^2);
        plot(log(lambdas(1)), press0/sum(y.^2), 'ko', 'MarkerFaceColor', [0,0,0]);

        press0approx = sum((diag(diag(S).^-2/mean(diag(S).^-2)) * U' * y).^2);
        plot(log(lambdas(1)), press0approx/sum(y.^2), 'ro');
    end
end

Part II. Adding pure noise predictors as a form of regularization

Good arguments were made by @Jonny, @Benoit, @Paul, @Dikran, and others that increasing the number of predictors will shrink the minimum-norm OLS solution. Indeed, once $p>n$, any new predictor can only decrease the norm of the minimum-norm solution. So adding predictors will push the norm down, somewhat similar to how ridge regression is penalizing the norm.

So can this be used as a regularization strategy? We start with $n=80$ and $p=40$ and then keep adding $q$ pure noise predictors as a regularization attempt. I will do LOOCV and compare it with LOOCV for the ridge (computed as above). Note that after obtaining $\hat\beta$ on the $p+q$ predictors, I am "truncating" it at $p$ because I am only interested in the original predictors.

enter image description here

IT WORKS!!!

In fact, one does not need to "truncate" the beta; even if I use the full beta and the full $p+q$ predictors, I can get good performance (dashed line on the right subplot). This I think mimics my actual data in the question: only few predictors are truly predicting $y$, most of them are pure noise, and they serve as a regularization. In this regime additional ridge regularization does not help at all.

rng(42)
n = 80;
p = 40;
rho = .2;
y = randn(n,1);
X = repmat(y, [1 p])*rho + randn(n,p)*sqrt(1-rho^2);

lambdas = exp(-10:.1:20);
press = zeros(size(lambdas));
[U,S,V] = svd(X, 'econ');

for i = 1:length(lambdas)
    H = U * diag(diag(S).^2./(diag(S).^2 + lambdas(i))) * U';
    e = y - H*y;
    press(i) = sum((e ./ (1-diag(H))).^2);
end

figure('Position', [100 100 1000 300])
subplot(121)
plot(log(lambdas), press/sum(y.^2))
hold on
xlabel('Ridge penalty (log)')
plot(xlim, [1 1], 'k--')
title('Ridge regression (n=80, p=40)')
ylim([0 2])

ps = [0 20 40 60 80 100 200 300 400 500 1000];
error = zeros(n, length(ps));
error_trunc = zeros(n, length(ps));
for fold = 1:n
    indtrain = setdiff(1:n, fold);
    for pi = 1:length(ps)
        XX = [X randn(n,ps(pi))];
        if size(XX,2) < size(XX,1)
            beta = XX(indtrain,:) \ y(indtrain,:);
        else
            beta = pinv(XX(indtrain,:)) * y(indtrain,:);
        end
        error(fold, pi) = y(fold) - XX(fold,:) * beta;
        error_trunc(fold, pi) = y(fold) - XX(fold,1:size(X,2)) * beta(1:size(X,2));
    end
end

subplot(122)
hold on
plot(ps, sum(error.^2)/sum(y.^2), 'k.--')
plot(ps, sum(error_trunc.^2)/sum(y.^2), '.-')
legend({'Entire beta', 'Truncated beta'}, 'AutoUpdate','off')
legend boxoff
xlabel('Number of extra predictors')
title('Extra pure noise predictors')
plot(xlim, [1 1], 'k--')
ylim([0 2])
$\endgroup$
5
  • $\begingroup$ @MartijnWeterings In this experiment, I start with n=80 and p=40. As the total number of predictors (p+q) approaches n=80, the problem becomes ill-conditioned and the OLS solution overfits drastically. There is an enormous peak in the error around q=40. As soon as p+q>n, the "minimum-norm" constraint kicks in and the error starts decreasing but it takes some time until it gets back to where it was with q=0. It happens around q=70, i.e. p+q=130. After that, the error is decreasing even further and this part of the plot is similar to the ridge regression plot. Does it make sense? $\endgroup$
    – amoeba
    Commented Feb 20, 2018 at 11:17
  • $\begingroup$ @MartijnWeterings On the 1st comment: we are on the same page. On the 2nd comment: in my question I am not truncating beta, that's right. But actually if I don't truncate beta in my simulation (use y(fold) - XX(fold,:) * beta instead of XX(fold,1:size(X,2)) * beta(1:size(X,2))), then the results don't change too much. I guess I should add this to my answer. I think my original data shows this kind of behaviour. $\endgroup$
    – amoeba
    Commented Feb 20, 2018 at 11:50
  • $\begingroup$ (1/2): I am still working my way through all of the comments and code to understand, but a thought occurs to me: is there a relationship between this phenomenon we are observing, and the relationship between ridge regression and random effects? $\endgroup$ Commented Feb 20, 2018 at 15:23
  • $\begingroup$ (2/2): Per Randel's answer here (stats.stackexchange.com/questions/122062/…), we see an estimation equivalent between random effects and ridge regression, where lambda is equal to the ratio of the residuals to the variance of the random effect. Here, per Benoit Sanchez's answer, we see that ridge regression is equivalent to adding an arbitrary number of of fake independent predictors each with variance equal to a function of lambda and the number of parameters. It seems to me there is a conceptual relationship. $\endgroup$ Commented Feb 20, 2018 at 15:25
  • $\begingroup$ @amoeba it was a mistake. adding a scaled vector y to the matrix X does regularize somewhat but not the same as ridge regression or noise vectors. It does however make me wonder what happens when we subtract a bit of $y$ from each x in order to make every variable slightly negatively correlated (or less positive) with the y vector. This in order to perform some 'negative' regularization. That in order to 'undo' the regularization of the 1000 vectors (at some point it may become too much, as you see with the peak/optimum regularization coefficient being now almost out of range). $\endgroup$ Commented Feb 23, 2018 at 10:08
18
+50
$\begingroup$

Here is an artificial situation where this occurs. Suppose each predictor variable is a copy of the target variable with a large amount of gaussian noise applied. The best possible model is an average of all predictor variables.

library(glmnet)
set.seed(1846)
noise <- 10
N <- 80
num.vars <- 100
target <- runif(N,-1,1)
training.data <- matrix(nrow = N, ncol = num.vars)
for(i in 1:num.vars){
  training.data[,i] <- target + rnorm(N,0,noise)
}
plot(cv.glmnet(training.data, target, alpha = 0,
               lambda = exp(seq(-10, 10, by = 0.1))))

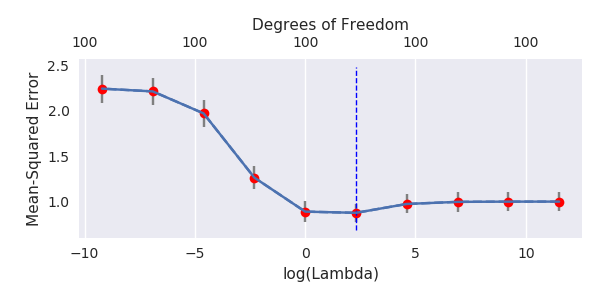
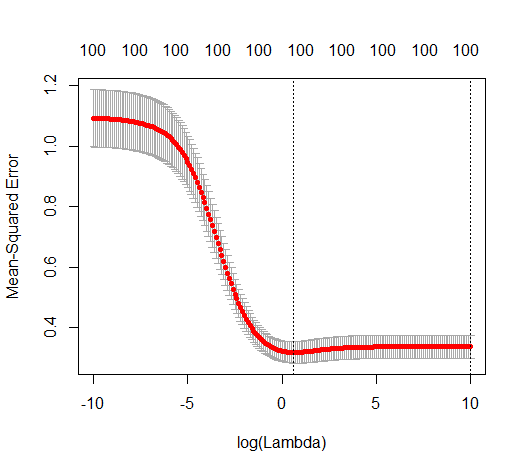
MSE for various lambda with 100 predictors

100 variables behave in a "normal" way: Some positive value of lambda minimizes out of sample error.

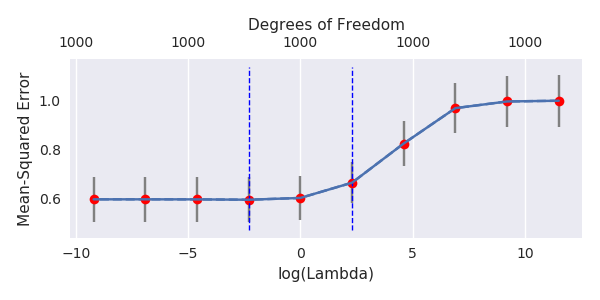
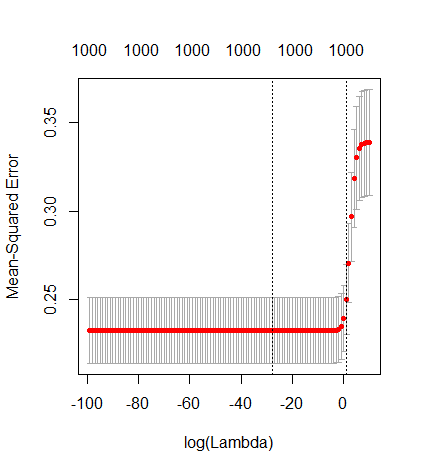
But increase num.vars in the above code to 1000, and here is the new MSE path. (I extended to log(Lambda) = -100 to convince myself.

MSE for various lambda with 1000 predictors

What I think is happening

When fitting a lot of parameters with low regularization, the coefficients are randomly distributed around their true value with high variance.

As the number of predictors becomes very large, the "average error" tends towards zero, and it becomes better to just let the coefficients fall where they may and sum everything up than to bias them toward 0.

I'm sure this situation of the true prediction being an average of all predictors isn't the only time this occurs, but I don't know how to begin pinpoint the biggest necessary condition here.

EDIT:

The "flat" behavior for very low lambda will always happen, since the solution is converging to the minimum-norm OLS solution. Similarly the curve will be flat for very high lambda as the solution converges to 0. There will be no minimum iff one of those two solution is optimal.

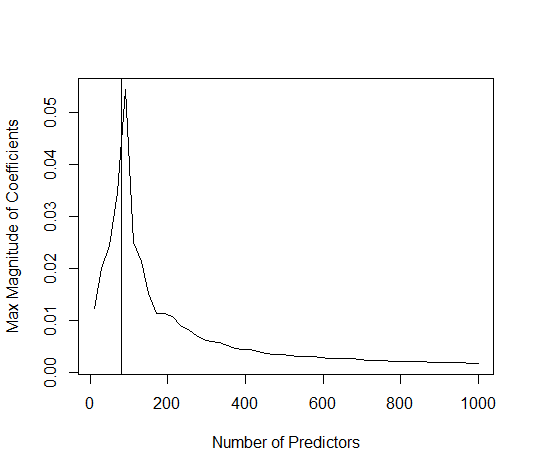
Why is the minimum-norm OLS solution so (comparably) good in this case? I think it is related to the following behavior that I found very counter-intuitive, but on reflection makes a lot of sense.

max.beta.random <- function(num.vars){
  num.vars <- round(num.vars)
  set.seed(1846)
  noise <- 10
  N <- 80
  target <- runif(N,-1,1)
  training.data <- matrix(nrow = N, ncol = num.vars)

  for(i in 1:num.vars){
    training.data[,i] <- rnorm(N,0,noise)
  }
  udv <- svd(training.data)

  U <- udv$u
  S <- diag(udv$d)
  V <- udv$v

  beta.hat <- V %*% solve(S) %*% t(U) %*% target

  max(abs(beta.hat))
}


curve(Vectorize(max.beta.random)(x), from = 10, to = 1000, n = 50,
      xlab = "Number of Predictors", y = "Max Magnitude of Coefficients")

abline(v = 80)

Plot of max magnitude of coefficients as number of predictors increases

With randomly generated predictors unrelated to the response, as p increases the coefficients become larger, but once p is much bigger than N they shrink toward zero. This also happens in my example. So very loosely, the unregularized solutions for those problems don't need shrinkage because they are already very small!

This happens for a trivial reason. $y$ can be expressed exactly as a linear combination of columns of $X$. $\hat{\beta}$ is the minimum-norm vector of coefficients. As more columns are added the norm of $\hat{\beta}$ must decrease or remain constant, because a possible linear combination is to keep the previous coefficients the same and set the new coefficients to $0$.

$\endgroup$
28
  • 1
    $\begingroup$ (+1). The phenomenon thus seems to happens when predictors are correlated. It does not mean formally that the error curve has no minimum for positive $\lambda$, neither that the limit at 0 is not large. It just means that the curve tends to become flat, and that the threshold for how small $\lambda$ must be for regularization to stop working tends towards 0 for large $p$. Here this threshold goes beyond computational limit but Firebug's answer suggests it may always exist. $\endgroup$ Commented Feb 16, 2018 at 10:06
  • 1
    $\begingroup$ Why do you need glmnet in your update? If you only need minimum norm OLS solution then there is a direct formula (see the 2nd formula in my question) and if one computes SVD of $X=USV^\top$ then this formula becomes simply $\hat\beta=VS^{-1}U^\top y$. There is also probably a function in R that computes this solution but I don't really know R :) $\endgroup$
    – amoeba
    Commented Feb 16, 2018 at 13:42
  • 2
    $\begingroup$ Thinking about it some more it is not surprising at all. $y$ can be expressed exactly as a linear combination of vectors in $X$. $\hat{\beta}$ is the vector of coefficients with the smallest norm. When you add a vector the norm of $\hat{\beta}$ must decrease or stay the same size, because you could keep the old coefficients the same and set the new ones to zero. $\endgroup$ Commented Feb 16, 2018 at 15:24
  • 3
    $\begingroup$ Jonny's example is a good one because it has already been analyzed: see James-Stein estimator. When estimating the mean of a fixed vector $\mathbf{\theta}$ with dimension 3 or greater, we can always improve upon simple averaging by biasing towards zero, which is more or less what ridge regression does. I wonder if perhaps the improvement is too slight to be observed in this case? $\endgroup$
    – Paul
    Commented Feb 16, 2018 at 18:48
  • 3
    $\begingroup$ It is well-known fact that ridge regression is equivalent to adding $p$ extra "fake" samples to the dataset with each sample having $\sqrt{\lambda}$ value in one feature and zeros everywhere else, and all corresponding responses being zero. (It's trivial to rewrite the RR cost function in this form.) I am now wondering if there is a way to add extra features (e.g. pure noise?) that would have similar effect. Of course adding extra features means that $\hat\beta$ will increase its dimensionality but one could only look at its values at the "original" predictors. @Paul $\endgroup$
    – amoeba
    Commented Feb 17, 2018 at 21:54
7
$\begingroup$

So I decided to run nested cross-validation using the specialized mlr package in R to see what's actually coming from the modelling approach.

Code (it takes a few minutes to run on an ordinary notebook)

library(mlr)
daf = read.csv("https://pastebin.com/raw/p1cCCYBR", sep = " ", header = FALSE)

tsk = list(
  tsk1110 = makeRegrTask(id = "tsk1110", data = daf, target = colnames(daf)[1]),
  tsk500 = makeRegrTask(id = "tsk500", data = daf[, c(1,sample(ncol(daf)-1, 500)+1)], target = colnames(daf)[1]),
  tsk100 = makeRegrTask(id = "tsk100", data = daf[, c(1,sample(ncol(daf)-1, 100)+1)], target = colnames(daf)[1]),
  tsk50 = makeRegrTask(id = "tsk50", data = daf[, c(1,sample(ncol(daf)-1, 50)+1)], target = colnames(daf)[1]),
  tsk10 = makeRegrTask(id = "tsk10", data = daf[, c(1,sample(ncol(daf)-1, 10)+1)], target = colnames(daf)[1])
)

rdesc = makeResampleDesc("CV", iters = 10)
msrs = list(mse, rsq)
configureMlr(on.par.without.desc = "quiet")
bm3 = benchmark(learners = list(
    makeLearner("regr.cvglmnet", alpha = 0, lambda = c(0, exp(seq(-10, 10, length.out = 150))),
    makeLearner("regr.glmnet", alpha = 0, lambda = c(0, exp(seq(-10, 10, length.out = 150))), s = 151)
    ), tasks = tsk, resamplings = rdesc, measures = msrs)

Results

getBMRAggrPerformances(bm3, as.df = TRUE)
#   task.id    learner.id mse.test.mean rsq.test.mean
#1    tsk10 regr.cvglmnet     1.0308055  -0.224534550
#2    tsk10   regr.glmnet     1.3685799  -0.669473387
#3   tsk100 regr.cvglmnet     0.7996823   0.031731316
#4   tsk100   regr.glmnet     1.3092522  -0.656879104
#5  tsk1110 regr.cvglmnet     0.8236786   0.009315037
#6  tsk1110   regr.glmnet     0.6866745   0.117540454
#7    tsk50 regr.cvglmnet     1.0348319  -0.188568886
#8    tsk50   regr.glmnet     2.5468091  -2.423461744
#9   tsk500 regr.cvglmnet     0.7210185   0.173851634
#10  tsk500   regr.glmnet     0.6171841   0.296530437

They do basically the same across tasks.

So, what about the optimal lambdas?

sapply(lapply(getBMRModels(bm3, task.ids = "tsk1110")[[1]][[1]], "[[", 2), "[[", "lambda.min")
# [1] 4.539993e-05 4.539993e-05 2.442908e-01 1.398738e+00 4.539993e-05
# [6] 0.000000e+00 4.539993e-05 3.195187e-01 2.793841e-01 4.539993e-05

Notice the lambdas are already transformed. Some fold even picked the minimal lambda $\lambda = 0$.

I fiddled a bit more with glmnet and discovered neither there the minimal lambda is picked. Check:

EDIT:

After comments by amoeba, it became clear the regularization path is an important step in the glmnet estimation, so the code now reflects it. This way, most discrepancies vanished.

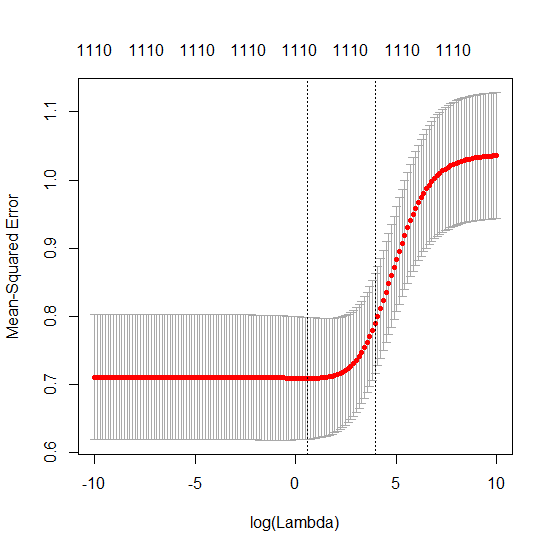
cvfit = cv.glmnet(x = x, y = y, alpha = 0, lambda = exp(seq(-10, 10, length.out = 150)))
plot(cvfit)

enter image description here

Conclusion

So, basically, $\lambda>0$ really improves the fit (edit: but not by much!).

How is it possible and what does it say about my dataset? Am I missing something obvious or is it indeed counter-intuitive?

We are likely nearer the true distribution of the data setting $\lambda$ to a small value larger than zero. There's nothing counter-intuitive about it though.

Edit: Keep in mind, though, the ridge regularization path makes use of previous parameter estimates when we call glmnet, but this is beyond my expertise. If we set a really low lambda in isolation, it'll likely degrade performance.

EDIT: The lambda selection does say something more about your data. As larger lambdas decrease performance, it means there are preferential, i.e. larger, coefficients in your model, as large lambdas shrink all coefficients towards zero. Though $\lambda\neq0$ means that the effective degrees of freedom in your model is smaller than the apparent degrees of freedom, $p$.

How can there be any qualitative difference between p=100 and p=1000 given that both are larger than n?

$p=1000$ invariably contains at least the same of information or even more than $p=100$.


Comments

It seems you are getting a tiny minimum for some non-zero lambda (I am looking at your figure), but the curve is still really really flat to the left of it. So my main question remains as to why λ→0 does not noticeably overfit. I don't see an answer here yet. Do you expect this to be a general phenomenon? I.e. for any data with n≪p, lambda=0 will perform [almost] as good as optimal lambda? Or is it something special about these data? If you look above in the comments, you'll see that many people did not even believe me that it's possible.

I think you're conflating validation performance with test performance, and such comparison is not warranted.

Edit: notice though when we set lambda to 0 after running the whole regularization path performance doesn't degrade as such, therefore the regularization path is key to understand what's going on!

Also, I don't quite understand your last line. Look at the cv.glmnet output for p=100. It will have very different shape. So what affects this shape (asymptote on the left vs. no asymptote) when p=100 or p=1000?

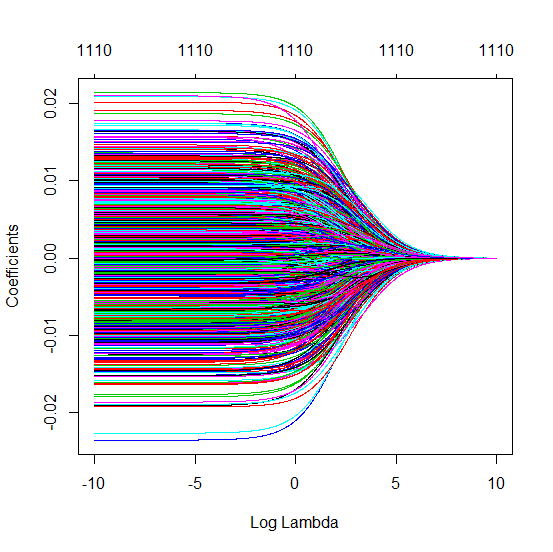
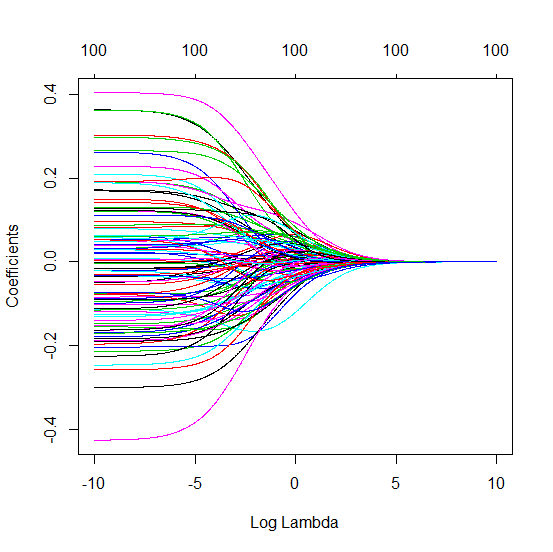
Let's compare the regularization paths for both:

fit1000 = glmnet(x, y, alpha = 0, lambda = exp(seq(-10,10, length.out = 1001)))
fit100 = glmnet(x[, sample(1000, 100)], y, alpha = 0, lambda = exp(seq(-10,10, length.out = 1001)))
plot(fit1000, "lambda")

enter image description here

x11()
plot(fit100, "lambda")

enter image description here

It becomes clear $p=1000$ affords larger coefficients at increasing $\lambda$, even though it has smaller coefficients for asymptotically-OLS ridge, at the left of both plots. So, basically, $p=100$ overfits at the left of the graph, and that probably explains the difference in behavior between them.

It's harder for $p=1000$ to overfit because, even though Ridge shrinks coefficients to zero, they are never reach zero. This mean that the predictive power of the model is shared between many more components, making it easier to predict around the mean instead of being carried away by noise.

$\endgroup$
9
  • $\begingroup$ +1 Thanks for doing these experiments! It seems you are getting a tiny minimum for some non-zero lambda (I am looking at your figure), but the curve is still really really flat to the left of it. So my main question remains as to why $\lambda\to 0$ does not noticeably overfit. I don't see an answer here yet. Do you expect this to be a general phenomenon? I.e. for any data with $n\ll p$, lambda=0 will perform [almost] as good as optimal lambda? Or is it something special about these data? If you look above in the comments, you'll see that many people did not even believe me that it's possible. $\endgroup$
    – amoeba
    Commented Feb 15, 2018 at 16:51
  • $\begingroup$ Also, I don't quite understand your last line. Look at the cv.glmnet output for p=100. It will have very different shape. So what affects this shape (asymptote on the left vs. no asymptote) when p=100 or p=1000? $\endgroup$
    – amoeba
    Commented Feb 15, 2018 at 16:52
  • $\begingroup$ Do you know if mlr selects lambda.min or lambda.1se (in the cv.glmnet terminology)? $\endgroup$
    – amoeba
    Commented Feb 15, 2018 at 18:34
  • $\begingroup$ @amoeba lambda.min. There's also a regr.cvglmnet learner, which probably allows one to select other rules. $\endgroup$
    – Firebug
    Commented Feb 15, 2018 at 18:42
  • $\begingroup$ Thanks. To be honest I don't understand the output of your 1e-100 benchmark. E.g. for p=1100 it gives MSE=1.45. But here there is no hyperparameter tuning in the inner loop so basically one does not need inner CV loop at all. Meaning that the result should be the same as with non-nested CV at lambda=1e-100. But we see on the first figure that the MSE there is around 0.7. It does not make sense to me. $\endgroup$
    – amoeba
    Commented Feb 15, 2018 at 20:05
6
$\begingroup$

How can (minimal norm) OLS fail to overfit?

In short:

Experimental parameters that correlate with the (unknown) parameters in the true model will be more likely to be estimated with high values in a minimal norm OLS fitting procedure. That is because they will fit the 'model+noise' whereas the other parameters will only fit the 'noise' (thus they will fit a larger part of the model with a lower value of the coefficient and be more likely to have a high value in the minimal norm OLS).

This effect will reduce the amount of overfitting in a minimal norm OLS fitting procedure. The effect is more pronounced if more parameters are available since then it becomes more likely that a larger portion of the 'true model' is being incorporated in the estimate.

Longer part:
(I am not sure what to place here since the issue is not entirely clear to me, or I do not know to what precision an answer needs to address the question)

Below is an example that can be easily constructed and demonstrates the problem. The effect is not so strange and examples are easy to make.

  • I took $p=200$ sin-functions (because they are perpendicular) as variables
  • created a random model with $n=50$ measurements.
    • The model is constructed with only $tm=10$ of the variables so 190 of the 200 variables are creating the possibility to generate over-fitting.
    • model coefficients are randomly determined

In this example case we observe that there is some over-fitting but the coefficients of the parameters that belong to the true model have a higher value. Thus the R^2 may have some positive value.

The image below (and the code to generate it) demonstrate that the over-fitting is limited. The dots that relate to the estimation model of 200 parameters. The red dots relate to those parameters that are also present in the 'true model' and we see that they have a higher value. Thus, there is some degree of approaching the real model and getting the R^2 above 0.

  • Note that I used a model with orthogonal variables (the sine-functions). If parameters are correlated then they may occur in the model with relatively very high coefficient and become more penalized in the minimal norm OLS.
  • Note that the 'orthogonal variables' are not orthogonal when we consider the data. The inner product of $sin(ax) \cdot sin(bx)$ is only zero when we integrate the entire space of $x$ and not when we only have a few samples $x$. The consequence is that even with zero noise the over-fitting will occur (and the R^2 value seems to depend on many factors, aside from noise. Of course there is the relation $n$ and $p$, but also important is how many variables are in the true model and how many of them are in the fitting model).
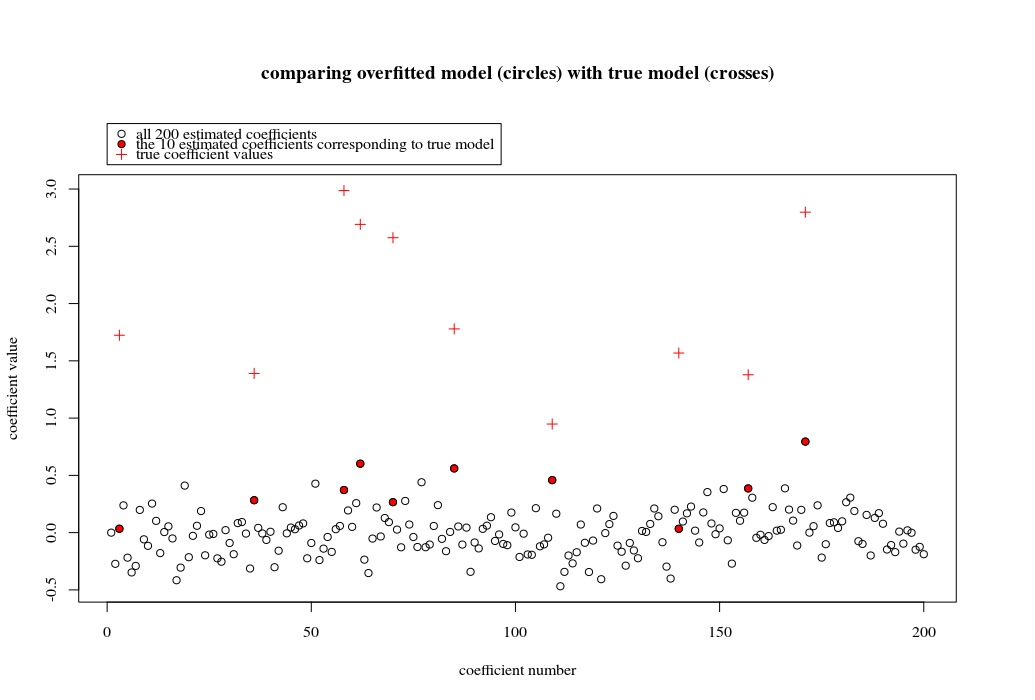
example of over-fitting being reduced

library(MASS)

par(mar=c(5.1, 4.1, 9.1, 4.1), xpd=TRUE)

p <- 200       
l <- 24000
n <- 50
tm <- 10

# generate i sinus vectors as possible parameters
t <- c(1:l)
xm <- sapply(c(0:(p-1)), FUN = function(x) sin(x*t/l*2*pi))

# generate random model by selecting only tm parameters
sel <- sample(1:p, tm)
coef <- rnorm(tm, 2, 0.5)

# generate random data xv and yv with n samples
xv <- sample(t, n)
yv <- xm[xv, sel] %*% coef + rnorm(n, 0, 0.1)

# generate model
M <- ginv(t(xm[xv,]) %*% xm[xv,])

Bsol <- M %*% t(xm[xv,]) %*% yv
ysol <- xm[xv,] %*% Bsol

# plotting comparision of model with true model
plot(1:p, Bsol, ylim=c(min(Bsol,coef),max(Bsol,coef)))
points(sel, Bsol[sel], col=1, bg=2, pch=21)
points(sel,coef,pch=3,col=2)

title("comparing overfitted model (circles) with true model (crosses)",line=5)
legend(0,max(coef,Bsol)+0.55,c("all 100 estimated coefficients","the 10 estimated coefficients corresponding to true model","true coefficient values"),pch=c(21,21,3),pt.bg=c(0,2,0),col=c(1,1,2))

Truncated beta technique in relation to ridge regression

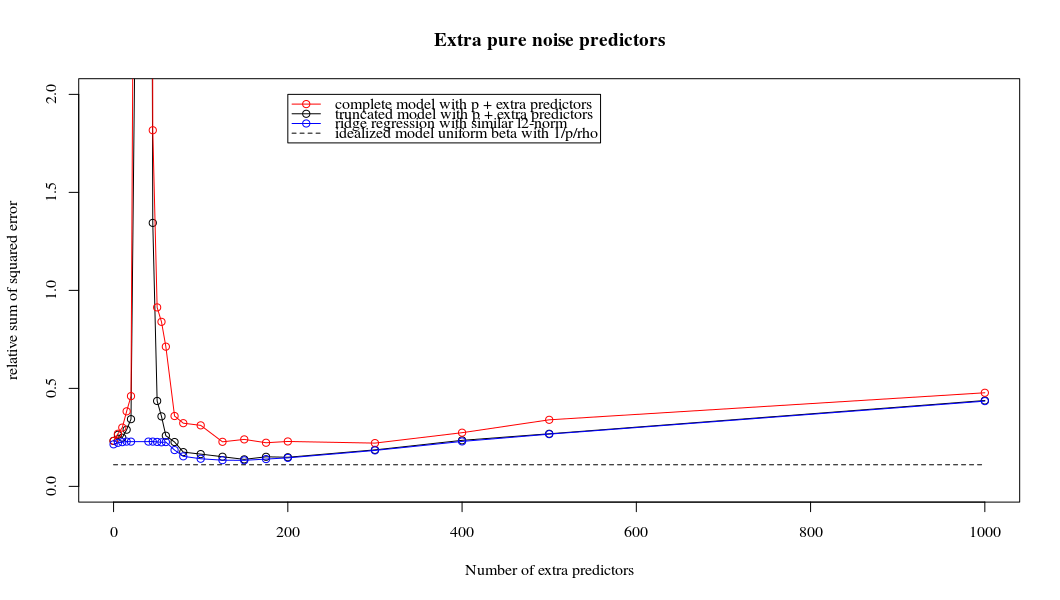
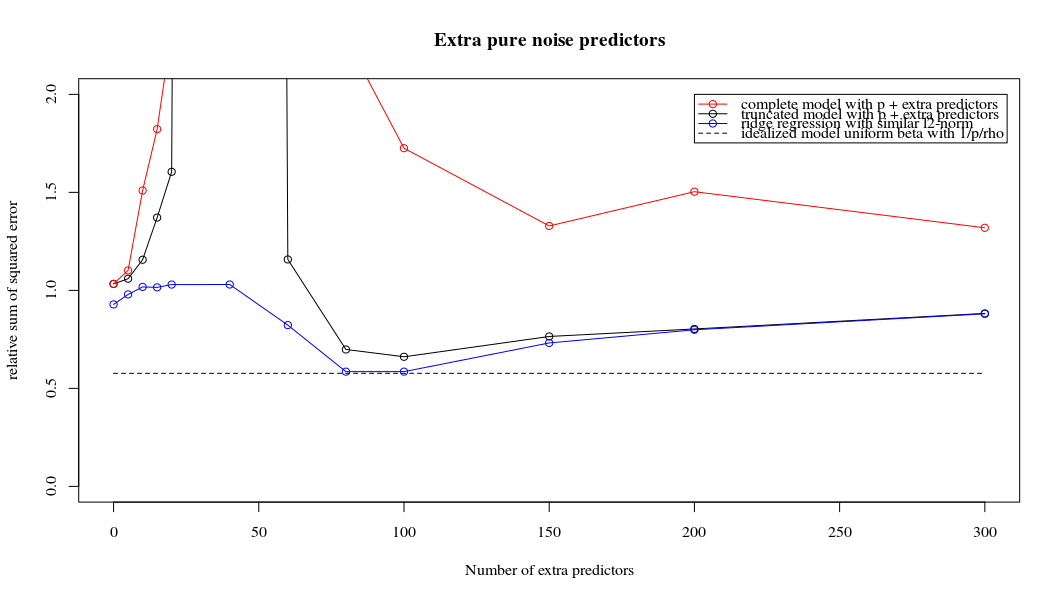
I have transformed the python code from Amoeba into R and combined the two graphs together. For each minimal norm OLS estimate with added noise variables I match a ridge regression estimate with the same (approximately) $l_2$-norm for the $\beta$ vector.

  • It seems like the truncated noise model does much the same (only computes a bit slower, and maybe a bit more often less good).
  • However without the truncation the effect is much less strong.
  • This correspondence between adding parameters and ridge penalty is not necessarily the strongest mechanism behind the absence of over-fitting. This can be seen especially in the 1000p curve (in the image of the question) going to almost 0.3 while the other curves, with different p, don't reach this level, no matter what the ridge regression parameter is. The additional parameters, in that practical case, are not the same as a shift of the ridge parameter (and I guess that this is because the extra parameters will create a better, more complete, model).

  • The noise parameters reduce the norm on the one hand (just like ridge regression) but also introduce additional noise. Benoit Sanchez shows that in the limit, adding many many noise parameters with smaller deviation, it will become eventually the same as ridge regression (the growing number of noise parameters cancel each other out). But at the same time, it requires much more computations (if we increase the deviation of the noise, to allow to use less parameters and speed up computation, the difference becomes larger).

Rho = 0.2 comparing truncated noise with ridge regression
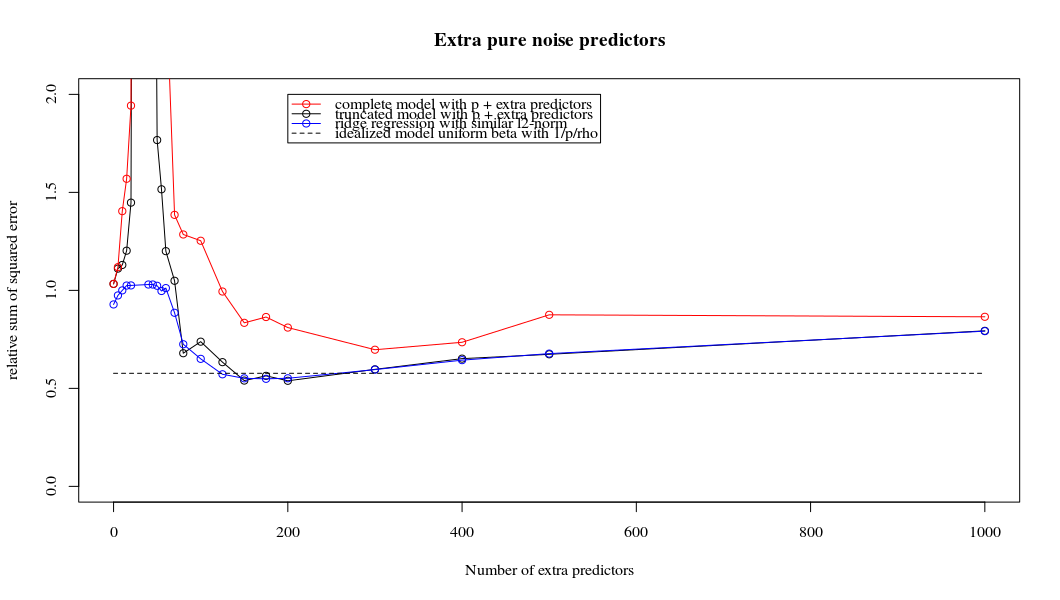
Rho = 0.4 comparing truncated noise with ridge regression

Rho = 0.2 increasing the variance of the noise parameters to 2 comparing truncated noise with ridge regression
code example

# prepare the data
set.seed(42)
n = 80
p = 40
rho = .2
y = rnorm(n,0,1)
X = matrix(rep(y,p), ncol = p)*rho + rnorm(n*p,0,1)*(1-rho^2)

# range of variables to add
ps = c(0, 5, 10, 15, 20, 40, 45, 50, 55, 60, 70, 80, 100, 125, 150, 175, 200, 300, 400, 500, 1000)
#ps = c(0, 5, 10, 15, 20, 40, 60, 80, 100, 150, 200, 300) #,500,1000)

# variables to store output (the sse)
error   = matrix(0,nrow=n, ncol=length(ps))
error_t = matrix(0,nrow=n, ncol=length(ps))
error_s = matrix(0,nrow=n, ncol=length(ps))

# adding a progression bar
pb <- txtProgressBar(min = 0, max = n, style = 3)

# training set by leaving out measurement 1, repeat n times 
for (fold in 1:n) {
    indtrain = c(1:n)[-fold]

    # ridge regression
    beta_s <- glmnet(X[indtrain,],y[indtrain],alpha=0,lambda = 10^c(seq(-4,2,by=0.01)))$beta
    # calculate l2-norm to compare with adding variables
    l2_bs <- colSums(beta_s^2)

    for (pi in 1:length(ps)) {
        XX = cbind(X, matrix(rnorm(n*ps[pi],0,1), nrow=80))
        XXt = XX[indtrain,]

        if (p+ps[pi] < n) {
            beta = solve(t(XXt) %*% (XXt)) %*% t(XXt) %*% y[indtrain]
        }
        else {
            beta = ginv(t(XXt) %*% (XXt)) %*% t(XXt) %*% y[indtrain]
        }

        # pickout comparable ridge regression with the same l2 norm      
        l2_b <- sum(beta[1:p]^2)
        beta_shrink <- beta_s[,which.min((l2_b-l2_bs)^2)] 

        # compute errors
        error[fold, pi] = y[fold] - XX[fold,1:p] %*% beta[1:p]
        error_t[fold, pi] = y[fold] - XX[fold,] %*% beta[]
        error_s[fold, pi] = y[fold] - XX[fold,1:p] %*% beta_shrink[]
    }
    setTxtProgressBar(pb, fold) # update progression bar
}

# plotting
plot(ps,colSums(error^2)/sum(y^2) , 
     ylim = c(0,2),
     xlab ="Number of extra predictors",
     ylab ="relative sum of squared error")
lines(ps,colSums(error^2)/sum(y^2))
points(ps,colSums(error_t^2)/sum(y^2),col=2)
lines(ps,colSums(error_t^2)/sum(y^2),col=2)
points(ps,colSums(error_s^2)/sum(y^2),col=4)
lines(ps,colSums(error_s^2)/sum(y^2),col=4)

title('Extra pure noise predictors')

legend(200,2,c("complete model with p + extra predictors",
               "truncated model with p + extra predictors",
               "ridge regression with similar l2-norm",
               "idealized model uniform beta with 1/p/rho"),
       pch=c(1,1,1,NA), col=c(2,1,4,1),lt=c(1,1,1,2))

# idealized model (if we put all beta to 1/rho/p we should theoretically have a reasonable good model)
error_op <- rep(0,n)
for (fold in 1:n) {
  beta = rep(1/rho/p,p)
    error_op[fold] = y[fold] - X[fold,] %*% beta
}
id <- sum(error_op^2)/sum(y^2)
lines(range(ps),rep(id,2),lty=2)
$\endgroup$
1
  • 2
    $\begingroup$ (+1) Thanks. I think the intuitive argument in the beginning of your answer makes sense. $\endgroup$
    – amoeba
    Commented Feb 20, 2018 at 23:29
2
$\begingroup$

If you're familiar with linear operators then you may like my answer as most direct path to understanding the phenomenon: why doesn't least norm regression fail outright? The reason is that your problem ($n\ll p$) is the ill posed inverse problem and pseudo-inverse is one of the ways of solving it. Regularization is an improvement though.

This paper is probably the most compact and relevant explanation: Lorenzo Rosasco et al, Learning, Regularization and Ill-Posed Inverse Problems. They set up your regression problem as learning, see Eq.3., where the number of parameters exceeds the number of observations: $$Ax=g_\delta,$$ where $A$ is a linear operator on Hilbert space and $g_\delta$ - noisy data.

Obviously, this is an ill-posed inverse problem. So, you can solve it with SVD or Moore-Penrose inverse, which would render the least norm solution indeed. Thus it should not be surprising that your least norm solution is not failing outright.

However, if you follow the paper you can see that the ridge regression would be an improvement upon the above. The improvement is really a better behavior of the estimator, since Moore-Penrose solution is not necessarily bounded.

UPDATE

I realized that I wasn't making it clear that ill-posed problems lead to overfitting. Here's the quote from the paper Gábor A, Banga JR. Robust and efficient parameter estimation in dynamic models of biological systems. BMC Systems Biology. 2015;9:74. doi:10.1186/s12918-015-0219-2:

The ill-conditioning of these problems typically arise from (i) models with large number of parameters (over-parametrization), (ii) experimental data scarcity and (iii) significant measurement errors [19, 40]. As a consequence, we often obtain overfitting of such kinetic models, i.e. calibrated models with reasonable fits to the available data but poor capability for generalization (low predictive value)

So, my argument can be stated as follows:

  • ill posed problems lead to overfitting
  • (n < p) case is an extremely ill-posed inverse problem
  • Moore-Penrose psudo-inverse (or other tools like SVD), which you refer to in the question as $X^+$, solves an ill-posed problem
  • therefore, it takes care of overfitting at least to some extent, and it shouldn't be surprising that it doesn't completely fail, unlike a regular OLS should

Again, regularization is a more robust solution still.

$\endgroup$
9
  • 1
    $\begingroup$ (+1) Thanks, but I don't quite see how this paper is relevant. I will look at it tomorrow in more detail. Where exactly do they say that minimum norm OLS solution will not overfit or that minimum norm requirement can be seen as regularization? $\endgroup$
    – amoeba
    Commented Feb 21, 2018 at 22:35
  • 1
    $\begingroup$ Let’s discuss when you read the paper. They don’t say psudo inverse is regularization. What they say is that it is the solution to the ill posed problem. What I’m saying is that overfitting is due to ill posed ness of the problem, so by addressing the latter you take care of the former albeit not as well as with regularization. $\endgroup$
    – Aksakal
    Commented Feb 21, 2018 at 22:56
  • 1
    $\begingroup$ I think the puzzling thing is not that the minimum norm solution does not ameliorate over-fitting to some extent, but that adding more regularisation doesn't improve things further. Also why the minimum norm solution is more effective as the number of features grows larger. My intuition is that problems with more parameters need more regularisation (all things being otherwise equal) rather than less. This is a really interesting problem, and may help explan why e.g. even unregularised neural networks do not over-fit as much as you might expect. $\endgroup$ Commented Feb 22, 2018 at 11:50
  • 1
    $\begingroup$ @Dikran Actually other forms or regularization can still improve the performance: e.g. I can improve the performance (compared to the minimum-norm OLS) with principal component regression or with elastic net. It's just that ridge regularization becomes useless. The analogy to neural networks is a fascinating thought that hasn't crossed my mind. What I did think about recently though, is that no wonder nobody understands why tricky deep learning things like batch normalization really work, given that even linear ridge regression from Statistics 101 can be so puzzling :-) $\endgroup$
    – amoeba
    Commented Feb 22, 2018 at 12:53
  • 2
    $\begingroup$ This is not the main question at hand but I think that this otherwise excellent series of questions, answers, and comments got sidetracked from bringing in cross-validation. For this discussion it would be far simpler to compute the population linear predictor from the $\beta$s that were used to simulate the data, and to compute MSE of any estimator of the linear predictor. And I have seen a case where for $n << p$ I could not find an optimum corrected AIC for ridge regression (Rrms package ols function). But I need to re-run that using the true linear predictor as the gold standard. $\endgroup$ Commented Feb 22, 2018 at 13:54

Your Answer

By clicking “Post Your Answer”, you agree to our terms of service and acknowledge you have read our privacy policy.

Not the answer you're looking for? Browse other questions tagged or ask your own question.