1
$\begingroup$

I have some count data of advanced stage juvenile snails in tanks that are sampled every 4 days for 4 sample points. I want to see how much the snail development stages change with a changing dosage of algae (3 tanks per dosage). So the number of advanced juvenile snails (a proportion of the total snails) is the response (Count), dosage of algae is a fixed predictor (continuous), and tanks are included as a random factor.

Here is a sample of the data:

 head(dat)
  Day Tank Dose      Count
1   1    1  100 0.00000000
2   1    8  100 0.08333333
3   1   13  100 0.07692308
4   1   17   75 0.00000000
5   1    4   75 0.00000000
6   1    5   75 0.00000000

Importantly, my data also has a time variable (Day), since the tanks were repeatedly sampled every 4 days, and this sampling was destructive, meaning the tank population decreased each time. Also the stage of the snails would increase with time, and would depend on the stages of the snails at the previous time points (obviously).

How can I account for this repeated measures aspect? The below code is what I have so far, but to me this says I am looking for an interaction between Dose and Day. I'm not sure if this is what I want. The effect of algal Dose is the primary focus here.

glmer(Count ~ Dose * Day + (1| Tank) , data = dat, family= "poisson")

Any advice would be very much appreciated.

$\endgroup$
6
  • $\begingroup$ The model you are describing seems to be missing an 'm'. Including random effects requires a generalized linear mixed model (GLMM). You could use the function glmer(y ~ x + (1|Tank) in the package lme4 to model a random effect for tank. That being said, how and why did you rescale the counts? Do you know the total number of snails at each time point? I don't fully understand your response variable, but my first thought would be to model the counts with a Poisson or negative binomial GLMM. $\endgroup$ Commented Feb 21, 2018 at 8:47
  • $\begingroup$ @FransRodenburg, thanks so much for the comment. You are right about the extra 'm'. I misinterpreted another answer. I guess this is one of those 'wrong' questions you were talking about. I have edited the question and also removed the scaling. The total tank population is not known, only sample aliquots are taken and counted for each tank, giving an estimate. $\endgroup$
    – J.Con
    Commented Feb 21, 2018 at 20:27
  • $\begingroup$ I think it would be better to use the original counts, even if they are only a portion of the total number of snails in the tank. Could you clarify why the counts are non-integer (e.g. 0.0833...)? $\endgroup$ Commented Feb 22, 2018 at 5:12
  • $\begingroup$ @FransRodenburg thanks again for the comment. The snails are so small they must be counted under a microscope. So the numbers represent the average counts across 3 aliquots from each tank (so if aliquot 1 had 1 advanced stage snail, aliquot 2 had 1, and aliquot 3 had 0, the average would be 0.67). This was then converted to a proportion of the total snails counted. $\endgroup$
    – J.Con
    Commented Feb 22, 2018 at 20:46
  • $\begingroup$ Ah okay, I understand. In that case, it might be easier to sum the 3 aliquots rather than average them. This way you will still have integer counts, which can be modeled with a Poisson or negative binomial GLMM. $\endgroup$ Commented Feb 23, 2018 at 6:19

1 Answer 1

4
+50
$\begingroup$

I will try to summarize the comment section and give my thoughts on the dependency in the data. As you have already figured out, a GLMM can model this type of data. The important choices for this type of model are the residual structure and the random effects. The interaction you have included in your model already considers all combinations of effects in the fixed part.

Residual Distribution

The number of observed mature snails is a count. Counts follow a discrete, often skewed distribution. In case the counts are independent, this is the Poisson distribution. Since there are multiple sources of dependency you are trying to account for with a mixed model, it is not unthinkable that the variance in the number of snails exceeds that of the Poisson distribution. You can correct the estimated standard errors for this, by allowing for overdispersion in your model, using a quasi-Poisson distribution. Alternatively, you can use a discrete distribution that has an extra dispersion parameter by default, such as the negative binomial distribution.

The three aliquots of the tanks per day are pseudoreplication, reducing only the measurement error. You can sum them to end up with integer counts again.

Random Effect

A random effect in a mixed model is like considering the effect in the sample to come from some larger, normally distributed population. For example, patients in a study measured more than once are part of some larger group of patients, each with their own random deviation from the 'average' patient. There is a very good answer here that explains what it means to estimate a random effect rather than a fixed effect.

In your case, the tanks are like the patients in the previous example. A random intercept for tank estimates the variance of tanks, so that you can take into account that one tank could for example have slightly different starting conditions (more snail eggs, slightly different temperature, slightly different tank composition, etc.).

If the tanks are similar or identical in shape, size and overall content, then I think you have already accounted for the dependency in the data by estimating a random intercept with: (1 | Tank).

If on the other hand you expect different tanks to have different effects on e.g. the speed of maturation, the number of snail deaths over time or the effect of dosage (I'm not saying this is likely), you should estimate a random slope for Day or Dose, with: (0 + Day | Tank) or (0 + Dose | Tank).

It is also possible to estimate both (replace the zero with a one in the previous examples), although this is probably a waste of degrees of freedom in your case.

Consider for example measuring three trees' circumference as they grow older and wider. The trees might have different starting conditions, meaning they had already grown wider than the others at the age of their first measurement (random intercept). It is also possible that the trees have slightly different amounts of direct sunlight, irrigation or nutrient availability, causing them to grow at a different rate (random slope). I have tried to illustrate this below, with age on the x-axis and circumference on the y-axis:
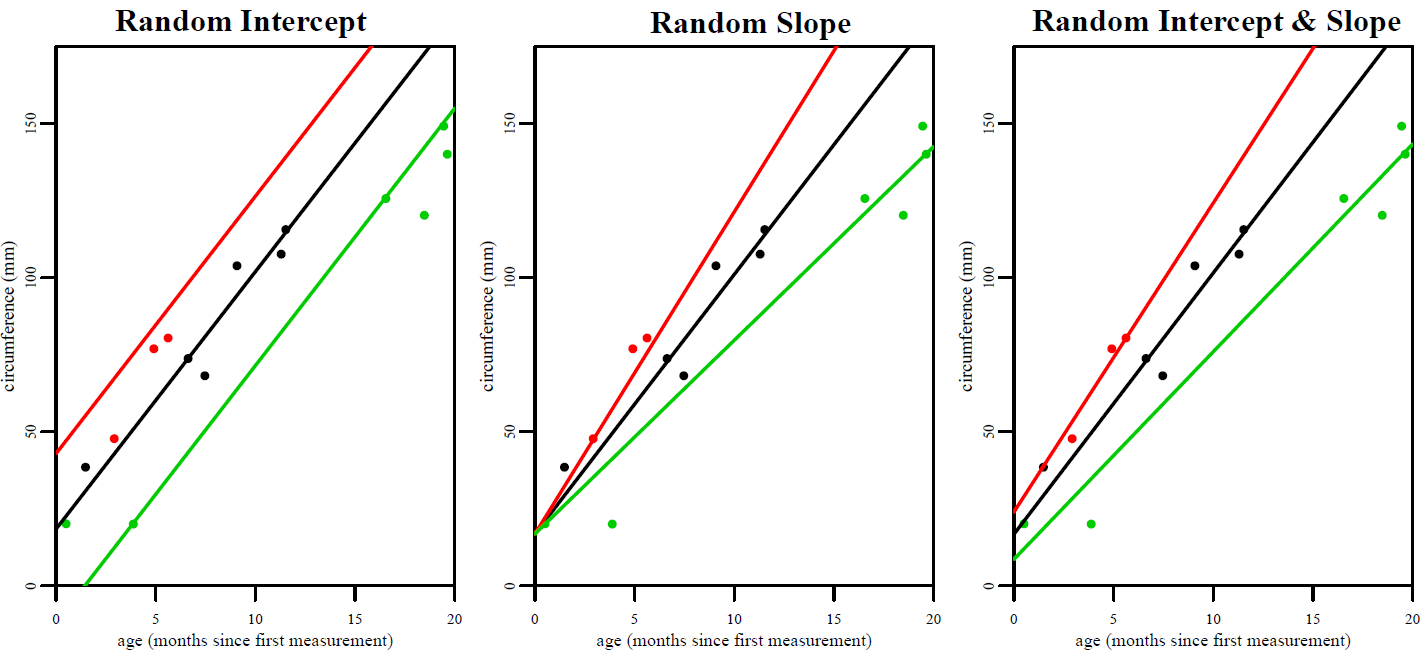
Random intercept, slope or both.


In summary, I think the model as you have edited it in your question now should work fine, so long as the destructive sampling you mention does not affect the total number of snails too drastically. However, you should inspect the residual deviance and its degrees of freedom to assess whether the Poisson distribution is appropriate for these data. There is already a question here about the diagnostics in particular that you could check out.

$\endgroup$
3
  • $\begingroup$ thank you so much, this is a very comprehensive answer. I feel much more confident in my model now. My only concern is when you say 'so long as the destructive sampling you mention does not affect the total number of snails too drastically', the sampling would have reduced the total population by approximately one fourteenth each time. Do you think this amount is small enough to not be of major concern? Also I see glmer no longer supports quasi- families, would an alternative to negative binomial distribution be an observation level random effect to account for over dispersion? $\endgroup$
    – J.Con
    Commented Feb 25, 2018 at 22:34
  • $\begingroup$ An observation level random effect is the same as the residual term, you cannot add that to a model. However, negative binomial GLMM is implemented in lme4, see glmer.nb(). The issue with destructive sampling is that you can't really say what the effect of time is easily, since this is influenced by the sampling itself. $\endgroup$ Commented Feb 25, 2018 at 22:44
  • $\begingroup$ Okay, thanks so much for your patience and perseverance. You earned the bounty. $\endgroup$
    – J.Con
    Commented Feb 25, 2018 at 22:51

Your Answer

By clicking “Post Your Answer”, you agree to our terms of service and acknowledge you have read our privacy policy.

Not the answer you're looking for? Browse other questions tagged or ask your own question.