I am estimating a model using MCMC (Gibbs Sampling). Because of the complexity of the model, I have been running two chains with many iterations.
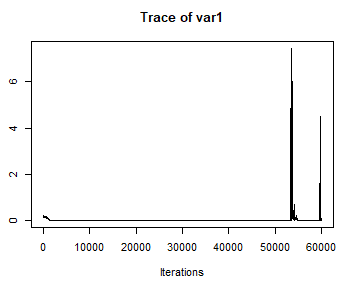
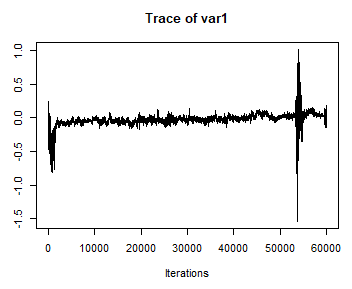
A plot of the draws for each parameter reveals a spike in the variance of the draws. After an additional few thousand iterations, the plot returns to the region of the distribution where has spent most of its time. I have run two chains in parallel with different starting values and different seeds for the random number generator. One chain does this at around 50,000th iteration, and the other does this around 25,000th iteration.
Here is a plot of a parameter sampled from an inverse gamma posterior in the first chain:
Here are similar results - but appropriately more symmetric - for a different parameter sampled from a normal posterior from the same chain:
The entire support of these distributions will be covered over an infinite number of iterations, but these spikes seem odd for a finite number of samples.
I have looked through my code to determine what could be going wrong and not found any apparent issues. I have seen a similar question asked here, but there hasn't been much discussion.
Any feedback on this behavior would be appreciated!


