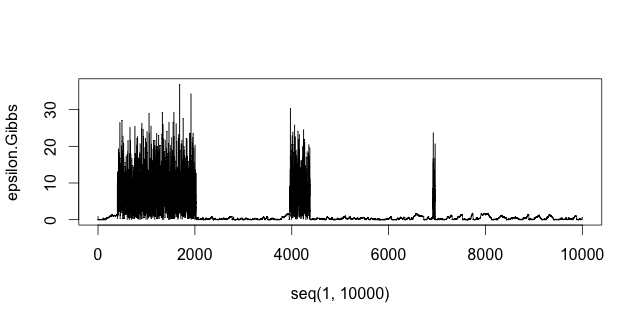
After performing Gibbs sampling, I looked at a trace plot for one of my parameters and it appeared to spike at certain points. Is this possible or is it likely that I just coded my sampler wrong?

$\begingroup$
$\endgroup$
1
-
1$\begingroup$ We would need more details to make an informed comment! $\endgroup$– Xi'anCommented Nov 15, 2015 at 8:58
Add a comment
|
1 Answer
$\begingroup$
$\endgroup$
0
It is possible, particularly if it is plausible that these values would fall into your posterior and that your mixing is not great. In that case you would want more MCMC samples and in practice would usually want to then thin them out. Presumably your autocorrelation plot does not look so great either?
There are of course other explanations including miscoding.
