Let's say I have linear regression model, and assume $\beta$ is the parameter. Assume the design matrix $X = (x_0,x_1,x_2,...x_n)$
If I split the data alternatively, like this:
$$ X^{(0)} = (x_0,x_2,x_4,...x_{2k}) $$
$$ X^{(1)} = (x_1,x_3,x_5,...x_{2k+1}) $$
and then fit the model using $X^{(0)}$, $X^{(1)}$ by solving least square. I would get two different parameter $\beta^{(0)}$, $\beta^{(1)}$.
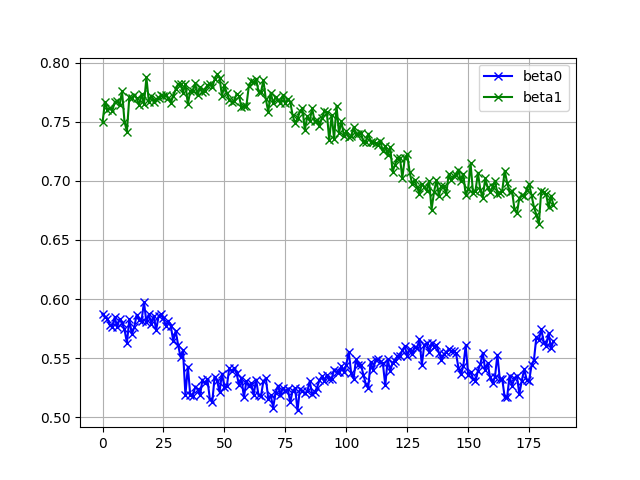
What I find is that $\beta^{(0)}$ has a significant different from $\beta^{(1)}$:
This plot is created by a sliding-window and then fit each window to get $\beta^{(0)}$, $\beta^{(1)}$. i.e.
For $t=0$, fit $(x_0,x_2,x_4,...x_{2k})$ for $\beta^{(0)}_t$
For $t=1$, fit $(x_2,x_4,x_6,...x_{2k+2})$ for $\beta^{(0)}_t$
For $t=2$, fit $(x_4,x_6,x_8,...x_{2k+4})$ for $\beta^{(0)}_t$
...
For $t=0$, fit $(x_1,x_3,x_5,...x_{2k+1})$ for $\beta^{(1)}_t$
For $t=1$, fit $(x_3,x_5,x_7,...x_{2k+3})$ for $\beta^{(1)}_t$
For $t=2$, fit $(x_5,x_7,x_9,...x_{2k+5})$ for $\beta^{(1)}_t$
...
and then plot $t$ vs $\beta^{(0)}_t$ and $t$ vs $\beta^{(1)}_t$ . Intended to discover if the parameter is the same across the time.
The model is not of one degree-of-freedom, I just plot one problematic parameter to show the situation.
The data is a real life data. I would use the model for prediction purpose.
My questions are:
(1) What I should do to model such different? It is a clearly violation for the model assumption that each observation is independent.
(2) How I split the data into $(x_0,x_1,x_2,...,x_n)$ is based on different group of the data and indeed the index $0,1,2,...,n$ is ordered by time. Is a mixed-effect model with a AR(1) like covariance structure relevant here? OR I should try dynamic linear model?
(3) I cannot find a meaningful reason to explain why splitting $X^{(0)}$, $X^{(1)}$ is relevant here. That's mean I cannot find an indicator variable to split data into 2 groups and fit a random slope model. Of course I can intentionally split the data alternatively like what I am doing now. However, I need to use the model for prediction, how can I know whether the next observation is in which group if I do not know the reason?

