5
$\begingroup$

Other than using AIC and BIC, I'd like to compare two different models via graphical interpretation, therefore my question is, is it possible to compare two regression models with each one having the same set of independent variables but different response variables with residual plots?


My primary aim is to set up two different regression models with different response variables, and both of the responses are the results of diagnostic tests for a specific disease. I'd like to find out the one that fits the data most to be able to suggest this model for calculating risk scores.

$\endgroup$
2
  • 1
    $\begingroup$ If the response variables are different, what do you want to compare the models for? Different response variable also means different residual plots. Of course you still can compare them and detect some patterns but it seems to me you'd have to be very careful. $\endgroup$
    – Denwid
    Commented Mar 29, 2018 at 15:14
  • $\begingroup$ If the residuals seems to be correlated maybe a joint model could be useful ... $\endgroup$ Commented Jul 18, 2022 at 20:10

1 Answer 1

1
$\begingroup$

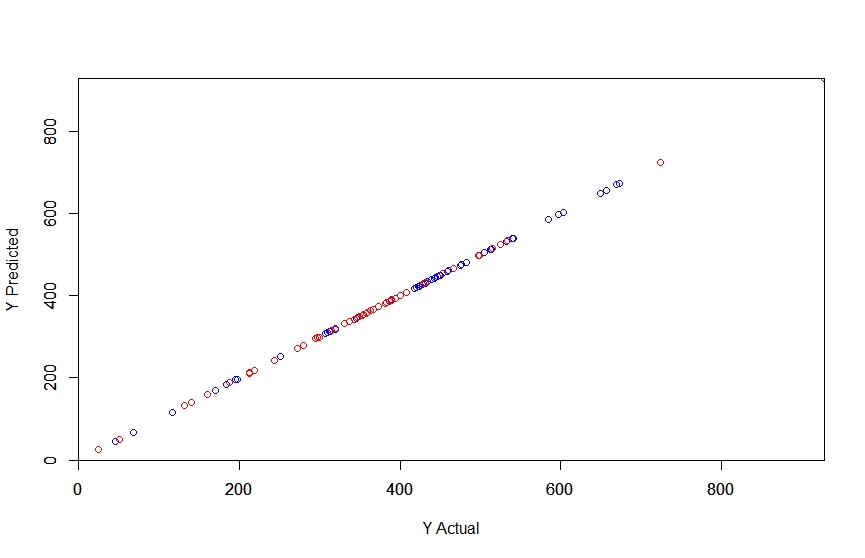
Assuming y1 and y2 as the response variables, predict the response variables using the corresponding models, say mod1 and mod2 and then plot the scatterplot between the actual and predicted in the same plot and same scales. In R that could be

py1 <- predict(mod1)
py2 <- predict(mod2)

plot(y1, py1, col='blue', 
     xaxs="i", yaxs="i", 
     xlim = c(0, max(y1)), ylim = c(0, max(py1)), 
     xlab = 'Y Actual', ylab = 'Y Predicted')
par(mfrow=c(1, 1), new=TRUE)
plot(y2, py2, col='red',
     xaxs="i", yaxs="i", 
     xlab ="", ylab ="", 
     xlim = c(0, max(y1)), ylim = c(0, max(py1)))

enter image description here

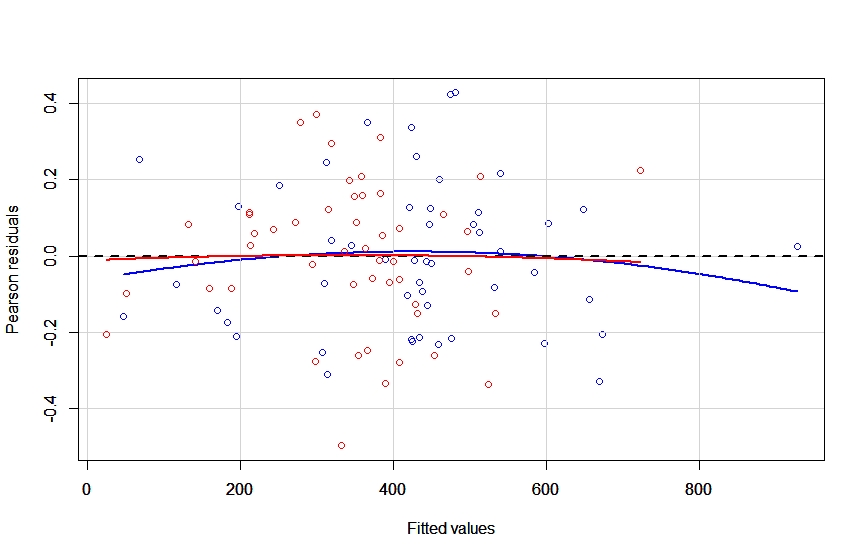
For residual plots

library(car)
residualPlot(mod1, col='blue', col.quad='blue', 
  xlim=c(min(mod1$fitted.values, mod2$fitted.values), 
  max(mod1$fitted.values, mod2$fitted.values)), 
  ylim=c(min(mod1$residuals, mod2$residuals), 
  max(mod1$residuals, mod2$residuals)))
par(mfrow=c(1,1), new=TRUE)

residualPlot(mod2, col='red', col.quad='red', 
  xlim=c(min(mod1$fitted.values, mod2$fitted.values), 
   max(mod1$fitted.values, mod2$fitted.values)), 
   ylim=c(min(mod1$residuals, mod2$residuals), 
   max(mod1$residuals, mod2$residuals)),
             xlab="", ylab="")

enter image description here

$\endgroup$

Your Answer

By clicking “Post Your Answer”, you agree to our terms of service and acknowledge you have read our privacy policy.

Not the answer you're looking for? Browse other questions tagged or ask your own question.