I've found myself in a situation where I have been given a model that has been developed from what I believe to be the "this seems right" approach. The model in question is very complex but it has no associated error margins or tests of correctness. I.e., there is nothing supporting this model to be good.
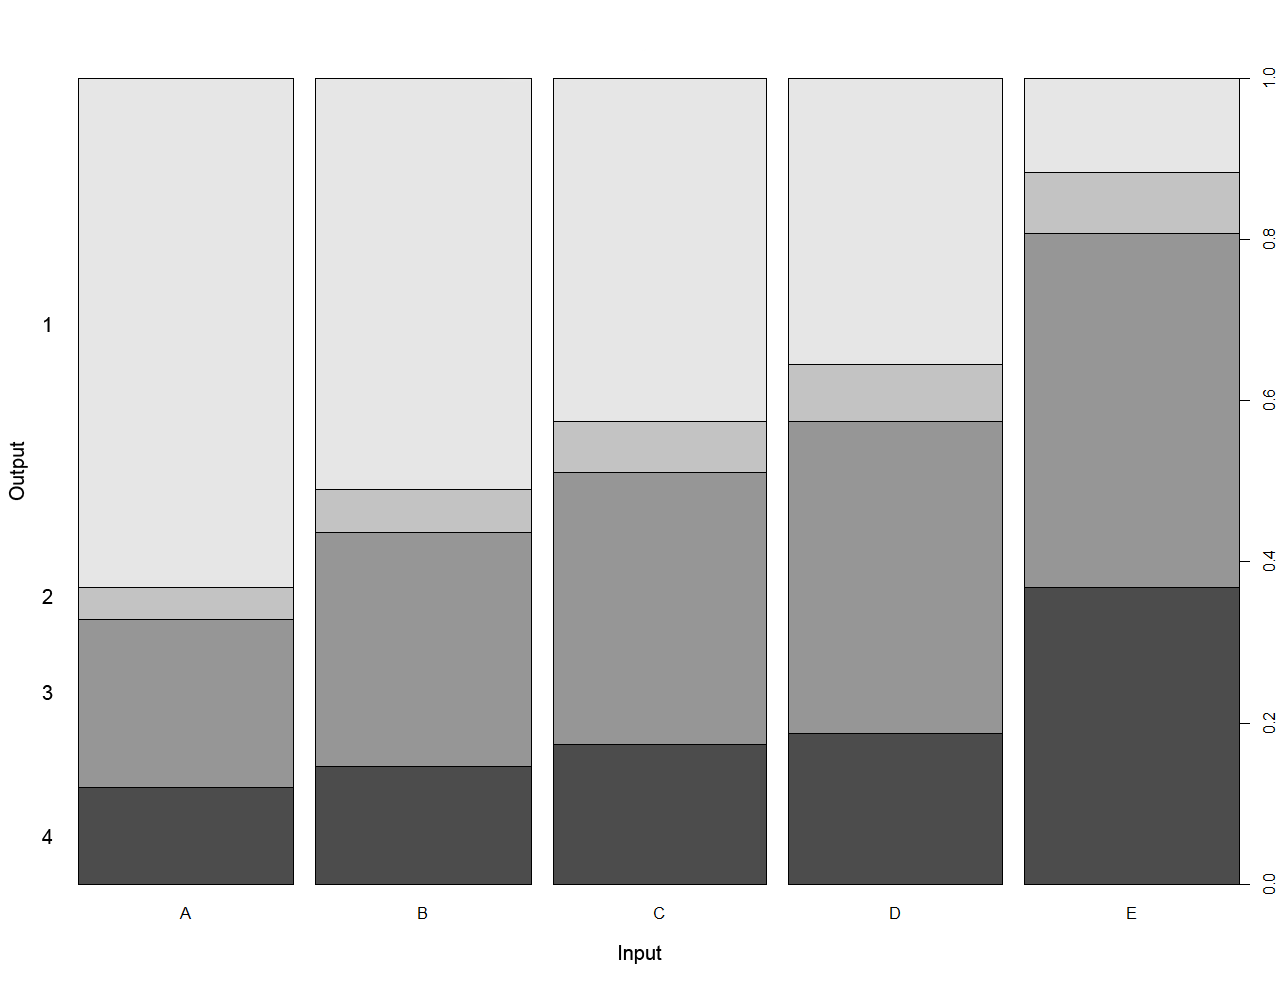
To verify the model I've generated 100,000 uniformly distributed data points (the model inputs are all categorical) that I ran through the model (to get the categorical output). I've then started to plot each input variable vs the output variable density. I expect a good model to have plots with varying density for each input value, like this one:

(Note, A,B,C,D,E denotes the different values of a input variable and 1,2,3,4 the different values of the output variable.)
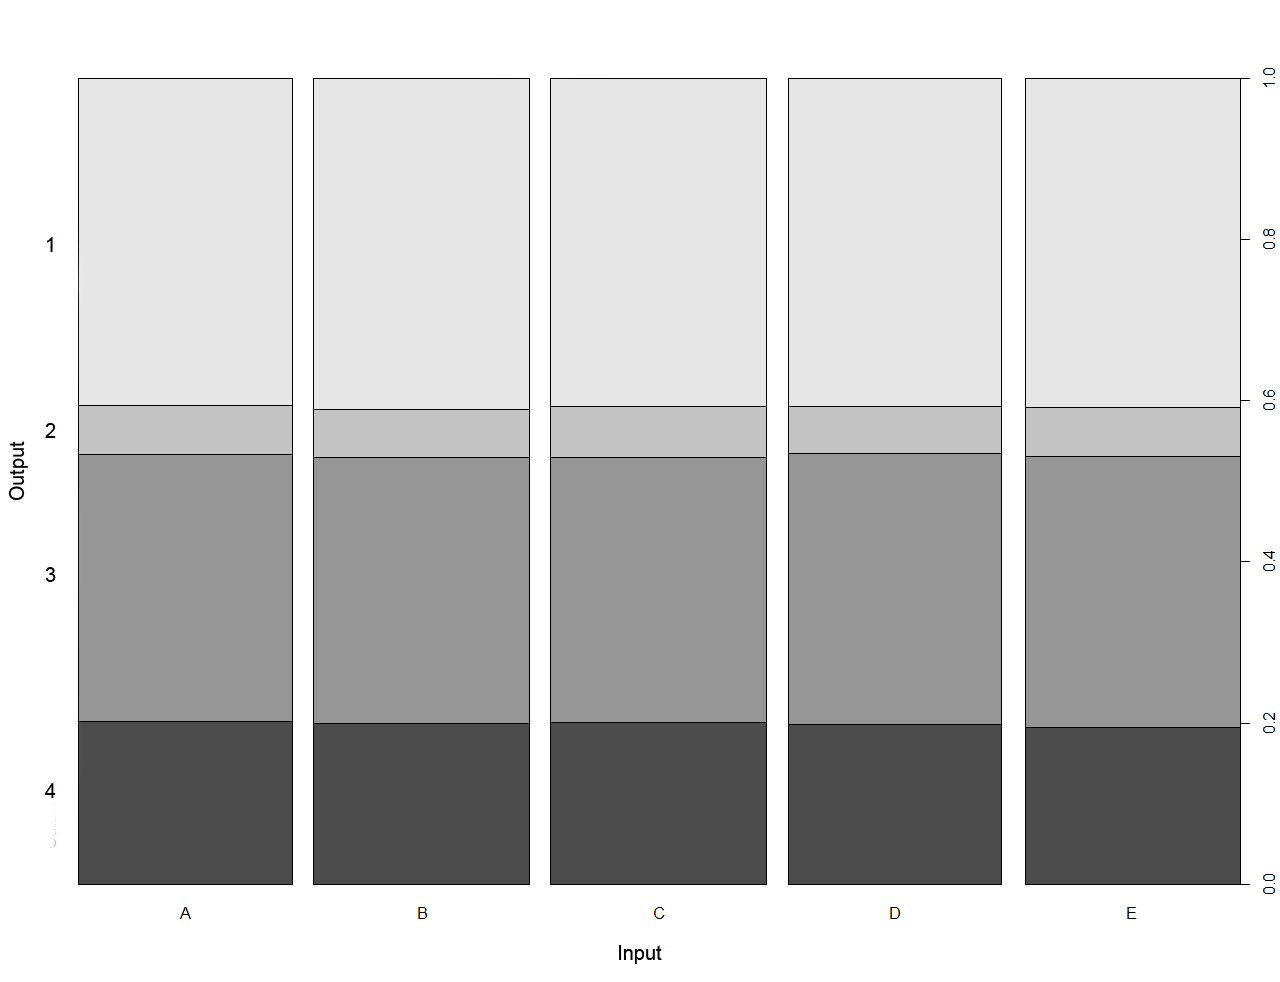
What I found however is that on almost all the input variables I get plots with constant densities for each input value, like this:

(Note, A,B,C,D,E denotes the different values of a input variable and 1,2,3,4 the different values of the output variable.)
My question is simply: am I right to say that variables with densities like the ones plotted in the second graph are not contributing to the model? That they do not have any predictive power? Or am I missing something key here in evaluating this model?
Thanks a bunch for any answers and/or comments regarding my little situation!
P.S. Any hints/tricks on how to further evaluate a model without any validation data would be greatly appreciated!

almost all input variables[...] gives you constant densities... What doesn't? $\endgroup$