3
$\begingroup$

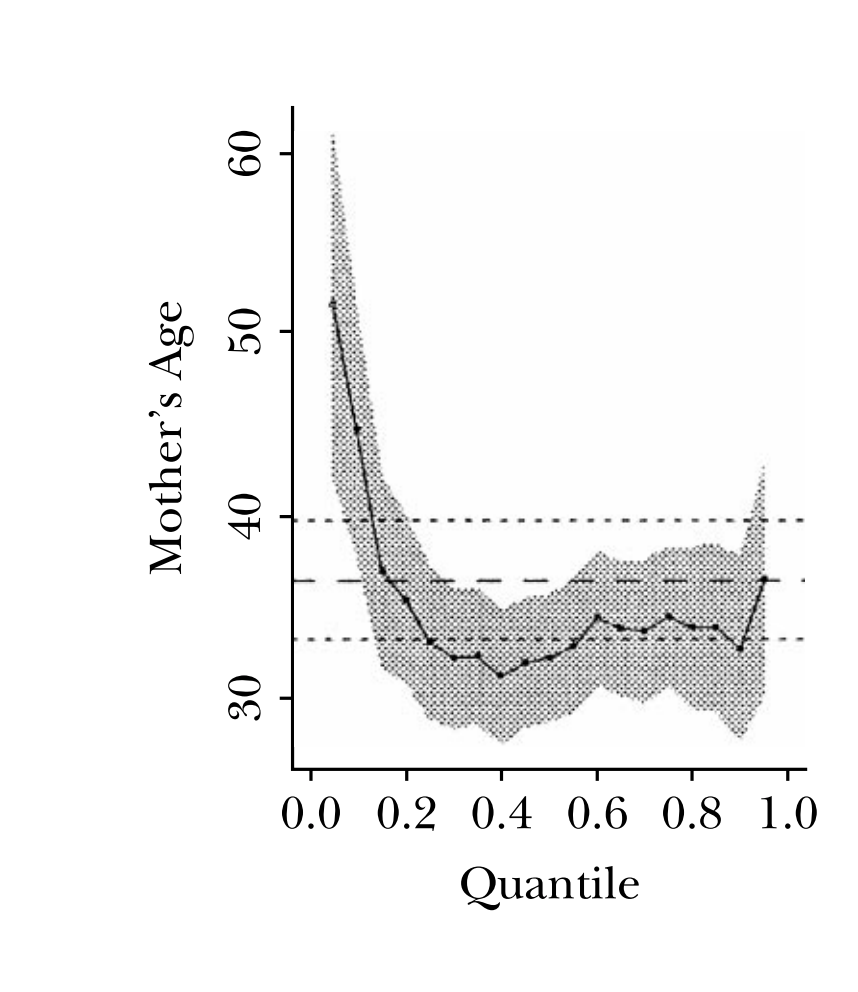
I am reading the paper of Roger Koenker about Quantile Regression. Specifically in Figure 4, I can see that at the lower quantiles, the effect of Mother's Age is strongest than at other higher quantiles, such as at the .1 quantile, 1 years old gained by mothers relates to about 45 grams gained by the baby. But how can the authors specifically interpret from the plot that

At the lower quantiles, the mother’s age tends to be more concave, increasing birthweight from age 18 to about age 30, but tending to decrease birthweight when the mother’s age is beyond 30

enter image description here

$\endgroup$

1 Answer 1

1
$\begingroup$

You first have to realize that the values on the y-axis are not age, but parameter estimates for mother's age. You next have to realize that (as the text shows) mother's age is a quadratic, so you have to look not just at this chart, but the one next to it in the paper.

At the 1st quantile, the parameter estimate for mother's age is about 50 and for age squared it is about -0.8, so, we have $50*Age - 0.8*Age^2$. Then you have to realize that age has been centered, so it ranges from about -20 to + 20. At the highest quantiles, it is more like $35*Age - 0.4*Age^2$.

$\endgroup$
2
  • $\begingroup$ I am clear that the y-axis is not Age, that's why I don't understand why the authors can observe how Age changes in lower quantiles. I still don't know how to derive Age from your suggestion $50*Age - 0.8*Age^2$. Would you mind elaborating in more detail? $\endgroup$ Commented Apr 18, 2018 at 5:04
  • $\begingroup$ You can't derive age from this curve or the equation. You plug in different values of age and see what happens. I admit the paper isn't as clear as it might be. $\endgroup$
    – Peter Flom
    Commented Apr 18, 2018 at 11:56

Your Answer

By clicking “Post Your Answer”, you agree to our terms of service and acknowledge you have read our privacy policy.

Not the answer you're looking for? Browse other questions tagged or ask your own question.