2
$\begingroup$

I am currently doing a binary logistic regression and am having an issue with variables becoming insignificant. I'd be very happy if someone has some help to offer.

I recently removed a smaller part of my sample (40/790) as these individuals were significantly different from the rest of the sample and basically made up their own population. As I removed them, two of my variables go insignificant. I have three independent variables that I wish to predict my dependent variable with. These independent variables are not present in the removed data, so there really should be no reason for them to change now. I have checked for multicollinearity and these values are not worrisome (1.5 ish for all of them). Any ideas as to how I should proceed?

If you run the regression without the variable that remains significant the other two are significant, if that's of any importance.

$\endgroup$
6
  • $\begingroup$ Are you sure the missing values in the removed portion were coded correctly as missing? $\endgroup$
    – Peter Flom
    Commented Apr 21, 2018 at 12:25
  • $\begingroup$ hmm. It's not really a problem with missing data. The removed part of the dataset is made up out of very young children who do not suffer from the medical issues that are used as independent variables - telling the effect of these issues is therefor not relevant for the purpose of my report. So those individuals were simply cut from the data, and shouldn't have had an impact. Let me know if it's unclear $\endgroup$
    – Carlos
    Commented Apr 21, 2018 at 12:32
  • $\begingroup$ If their missing data was incorrectly coded (e.g. someone coded missing as 999 and forgot to make that missing) then that would account for the fact that removing them had an effect on significiance. $\endgroup$
    – Peter Flom
    Commented Apr 21, 2018 at 12:39
  • $\begingroup$ Thank you! However there is no missing data. This was a concern for me too, but I've checked and there are no missing values. Simply 1 for "yes" and 0 for "no" - all cases are known $\endgroup$
    – Carlos
    Commented Apr 21, 2018 at 12:42
  • $\begingroup$ You already said that there is missing data. So, which is it? $\endgroup$
    – Peter Flom
    Commented Apr 21, 2018 at 12:43

2 Answers 2

1
$\begingroup$

If for the younger study participants the scores are always zero, but for older participants scores are not zero, then the regression will report a linear association that demonstrates how the zero scores differ from the non-zero scores in relation to Y. Once the sub-sample with zero scores are removed, the results will change because the zero scores no longer influence the coefficient estimates.

Consider the following example with three variables, Y (the dependent), age, and X (the predictor).

     +---------------+
     |  y   age    x |
     |---------------|
  1. | 22     7   23 |
  2. | 19     8   34 |
  3. | 15     7   43 |
  4. | 14     8   45 |
  5. | 10     9   20 |
     |---------------|
  6. | 14     9   19 |
  7. | 15    10   22 |
  8. | 19     7   19 |
  9. | 20    10   20 |
 10. | 10     8   33 |
     |---------------|
 11. |  1     4    0 |
 12. |  2     4    0 |
 13. |  3     5    0 |
 14. |  4     5    0 |
 15. |  5     6    0 |
     |---------------|
 16. |  6     6    0 |
 17. |  7     4    0 |
 18. |  8     5    0 |
 19. |  9     6    0 |
 20. | 10     4    0 |
     +---------------+

Below the regression results show that X is a significant predictor of Y. It seems that as X increases, so too does Y (b = .285).

. reg y x
------------------------------------------------------------------------------
           y |      Coef.   Std. Err.      t    P>|t|     [95% Conf. Interval]
-------------+----------------------------------------------------------------
           x |   .2825379   .0665803     4.24   0.000     .1426579    .4224178
       _cons |   6.722723   1.384966     4.85   0.000     3.813018    9.632428
------------------------------------------------------------------------------

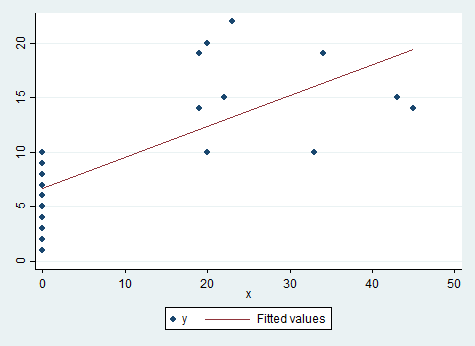
A scatterplot helps reveal what is happening with these data.
enter image description here

Note from this scatterplot the regression line shows a positive relation. This relation demonstrates how predicted Y changes across the range of X, starting at a score of zero.

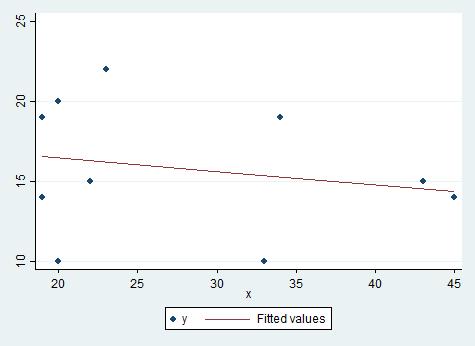
If scores for younger participants are removed, those 6 and under in this example, the relation between X and Y changes. Below are the regression results and scatterplot with younger participants removed.

. reg y x if age>6

------------------------------------------------------------------------------
           y |      Coef.   Std. Err.      t    P>|t|     [95% Conf. Interval]
-------------+----------------------------------------------------------------
           x |  -.0847018   .1399157    -0.61   0.562     -.407348    .2379444
       _cons |   18.15471   4.115996     4.41   0.002     8.663207    27.64621
------------------------------------------------------------------------------
enter image description here

As these results show, the nature of the relation changes dramatically once the sub-sample with X scores of zero are removed. It is likely you data are behaving much like this example.

$\endgroup$
0
$\begingroup$

OK, after clarification in the comments, there's no reason that variables couldn't go from significant to not sig, or vice versa. When you remove some data, all the results on the remaining data can change. Whether the subjects in the removed portion have particular values on the independent variables is not relevant.

Even if the relationships are exactly the same, the p value will change because the sample size is smaller. However, in your case, the relationships are different.

$\endgroup$
1
  • $\begingroup$ "There's no reason this could not happen" = ? $\endgroup$
    – rolando2
    Commented Apr 21, 2018 at 17:20

Your Answer

By clicking “Post Your Answer”, you agree to our terms of service and acknowledge you have read our privacy policy.

Not the answer you're looking for? Browse other questions tagged or ask your own question.