2
$\begingroup$

If $X, Y$ are two sets of observations of two random scalar (univariate) variables, one can determine if the expected values of the two variables are unequal, with appropriate tests. My question is: what happens when the observations are not precise?

Say, the observations are tuples $X_i=(a_i, b_i)$, $Y_j=(c_j, d_j)$. The pair $(a_i, b_i)$ denotes that the i-th observation of the first random variable is anywhere between $a_i$ and $b_i$, with an uniform probability in that interval. Generally, $b_i - a_i$ will not be constant across i, same for the other set of tuples. The application is biological data, where an expert provides estimates of variables that cannot be determined precisely (anymore), only as an interval.

I'd like to determine, whether the two samples have different expected values, ideally with some p-value.

My first idea was to calculate a PDF for each of the interval sets and to numerically integrate their "overlap area", which should yield the p-value. Is this line of thinking correct? Can anyone come up with different ideas?

$\endgroup$
2
  • $\begingroup$ Are you only interested in finding out if two distributions have the same mean? Or do you really want/need a theory/description, which you can extract a p-value from? $\endgroup$
    – cherub
    Commented Jun 7, 2018 at 14:29
  • $\begingroup$ I need to check if they have different means, but also know how that generalizes to the entire population (from which I only have a sample), so also a p-value. $\endgroup$ Commented Jun 7, 2018 at 14:37

1 Answer 1

2
$\begingroup$

Computer time is cheap, and thinking hurts. (Ascribed to Uwe Ligge.)

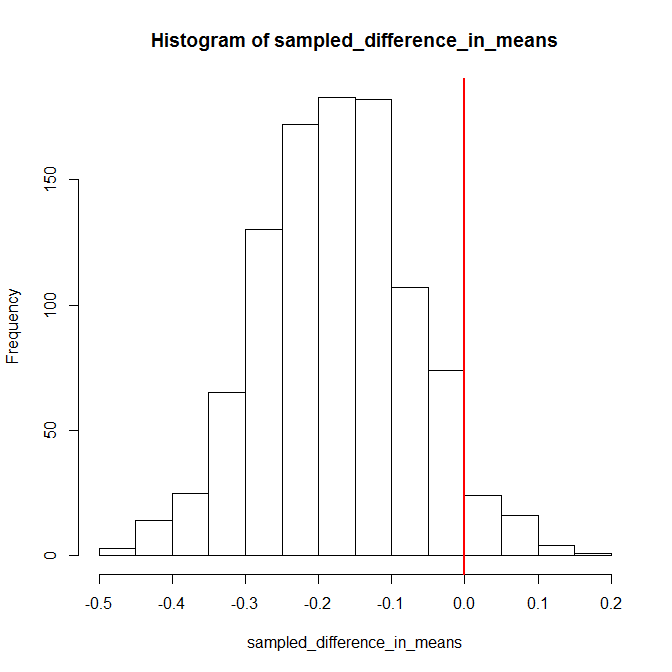
Simulate. Draw one point uniformly from each interval, so you have "pointwise" $X$ and $Y$. Record the difference in means between the "pointwise" $X$ and $Y$. Repeat a large number of times, e.g., 1,000 or 10,000 times. Check the proportion of sampled differences in means that is above or below zero for a one-sided test, or look at absolute values in the differences in means for a two-sided test.

There may be a theoretically correct calculation, potentially asymptotically. I submit that any gain in accuracy would be outweighed by the inaccuracy from your experts' judgments. And it's easier to go wrong in theory than in simulation.

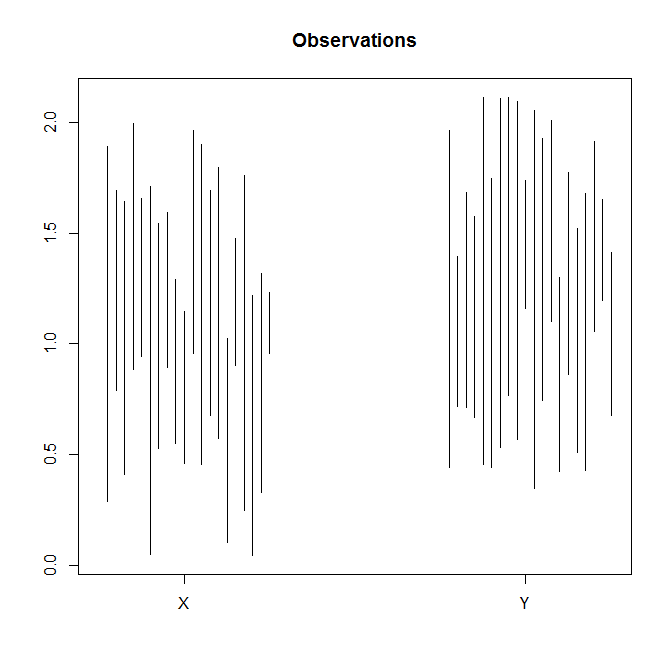
Here is some toy data and the resampling. In this particular case, we get $p=0.045$ for a one-sided test.

n_obs_per_group <- 20
set.seed(123)
XX <- data.frame(lower=runif(n_obs_per_group),upper=runif(n_obs_per_group)+1)
YY <- data.frame(lower=runif(n_obs_per_group)+0.3,upper=runif(n_obs_per_group)+1.3)

n_samples <- 1e3
sampled_difference_in_means <- rep(NA,n_samples)
for ( ii in 1:n_samples ) {
    XX_sample <- runif(n_obs_per_group,XX$lower,XX$upper)
    YY_sample <- runif(n_obs_per_group,YY$lower,YY$upper)
    sampled_difference_in_means[ii] <- mean(XX_sample)-mean(YY_sample)
}

plot(c(0,3),range(rbind(XX,YY)),type="n",xaxt="n",main="Observations",xlab="",ylab="")
lines(rep((1:n_obs_per_group)*0.05,each=3),t(as.matrix(cbind(XX,NA))))
lines(2+rep((1:n_obs_per_group)*0.05,each=3),t(as.matrix(cbind(YY,NA))))
axis(1,c(0.5,2.5),c("X","Y"))

hist(sampled_difference_in_means)
abline(v=0,col="red",lwd=2)
1-ecdf(sampled_difference_in_means)(0)
# [1] 0.045

observations

histogram of sampled differences in means

$\endgroup$
1
  • $\begingroup$ It didn't occur to me to sample from the ranges. This is exactly what I wanted. $\endgroup$ Commented Jun 7, 2018 at 14:38

Your Answer

By clicking “Post Your Answer”, you agree to our terms of service and acknowledge you have read our privacy policy.

Not the answer you're looking for? Browse other questions tagged or ask your own question.