2
$\begingroup$

Hi I am new to time series and I got this problem. At first I created a simple seasonal ARIMA model using auto.arima and forecast library.

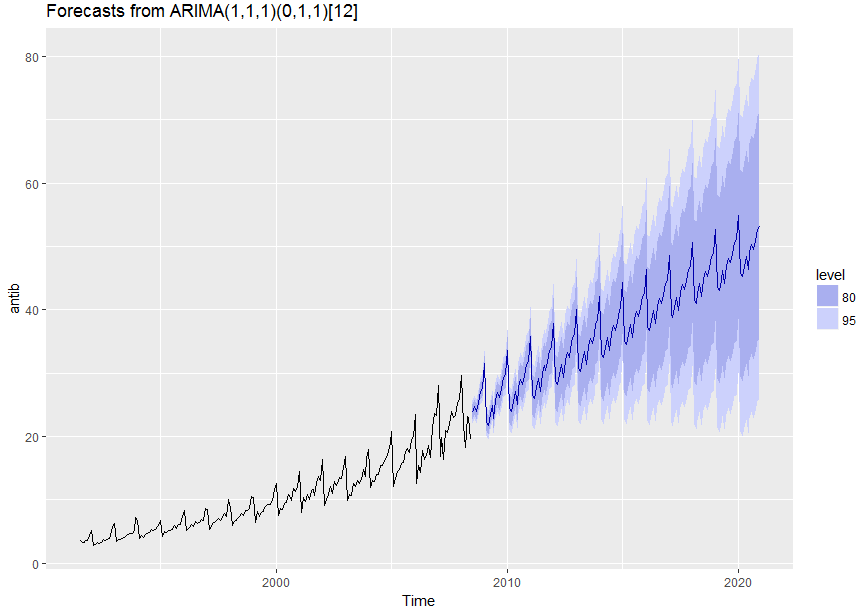
Then when I tried to make prediction using this model, variance always remained constant. It shouldnt be like that, when you look at train data, variance should be growing. Because of growing trend. (I tried this on other datasets and result was the same)

What should I do? How to change this model, to get rid of constant variance? :(

Thanks.

Code: antib = a10 model = auto.arima(antib, stationary = FALSE) prediction = forecast(model, h = 150) autoplot(prediction)

Forecast

$\endgroup$
6
  • 3
    $\begingroup$ How do you conclude that forecast variance is constant from looking at that plot? It quite obviously is not! Do you know what those blue shaded areas represent? $\endgroup$
    – jbowman
    Commented Jun 20, 2018 at 12:37
  • $\begingroup$ Well I assume that represent 80%,95% confidence interval. But shouldn t be the line(mean of prediction) wider(verticaly)? $\endgroup$ Commented Jun 20, 2018 at 12:42
  • $\begingroup$ The model you built is additive, not multiplicative, so the line itself won't vary. But the forecasts are clearly not constant variance, as the widening confidence intervals show. Try using a non-arima model, for example, ets. That allows for multiplicative components, which is what it seems you want (and would be better in this case.) $\endgroup$
    – jbowman
    Commented Jun 20, 2018 at 12:56
  • $\begingroup$ Thanks very much, So I m gonna look at ETS(never heard about it). Is it wise/possible to use ETS with multiple predictors as input variables? $\endgroup$ Commented Jun 20, 2018 at 13:12
  • $\begingroup$ An alternative to ETS is to set lambda=0 in the call to auto.arima. $\endgroup$ Commented Jun 20, 2018 at 14:20

1 Answer 1

1
$\begingroup$

Your question/response seems to raise the issue of detecting change points in trends that is in the expected value without assuming a possibly erroneous form of a multiplicative model. For exqmple 1,2,19,4,5,8,10,12,14,16,18,25,30,35,40,45 ,,, Data analytics http://docplayer.net/12080848-Outliers-level-shifts-and-variance-changes-in-time-series.html capable of detecting such structure might be in order ...or at least they would be in my pursuit of excellence.

$\endgroup$
3
  • $\begingroup$ why don't you post your actual data ....as an objective analysis might unveil some insights. $\endgroup$
    – IrishStat
    Commented Jun 25, 2018 at 9:39
  • $\begingroup$ I cannot publish real data, because of corporate policy. $\endgroup$ Commented Jul 16, 2018 at 10:55
  • $\begingroup$ then scale the data ... $\endgroup$
    – IrishStat
    Commented Jul 17, 2018 at 6:02

Your Answer

By clicking “Post Your Answer”, you agree to our terms of service and acknowledge you have read our privacy policy.

Not the answer you're looking for? Browse other questions tagged or ask your own question.