2
$\begingroup$

I have trained a model to predict heart attacks using random forest algorithm using H2O.

I have good performance in cross validation.

Now, I want to give more interpretation to the predictions in a test set, I used Lime and I followed this tutorial: https://kkulma.github.io/2017-11-07-automated_machine_learning_in_cancer_detection/

Everything works fine, now the issue is that I want to understand each explanation for each case, which means:

  1. What means Support?
  2. What means Contradicts?
  3. Interpret each rule given by the explanation example (2800 < dias_patologia_diabetes).
  4. What means explanation fit?

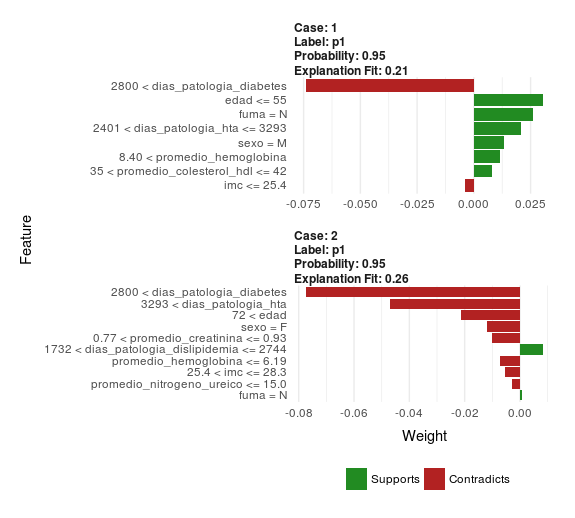
Attached the plot of 2 cases (those that have) more probability.

enter image description here

$\endgroup$
1
  • 1
    $\begingroup$ Hi, @Jasam, I don't think I'll have time to write a neat answer before the weekend, but have you checked Thomas Pedersen's overview of the LIME package? It gives you a very detailed description of how LIME works and what different metrics refer to. It should be a good start, at least $\endgroup$ Commented Jun 27, 2018 at 21:39

1 Answer 1

6
$\begingroup$

Succinctly:

  1. "Supports" means that the presence of that feature increases the probability to of that instance to be of that particular class/label.
  2. "Contradicts" means that the presence of that feature decreases the probability to of that instance to be of that particular class/label.
  3. LIME will discretize numerical features internally. Here, the continuous feature dias_patologia_diabetes was discretized in such way that we have a new variable (2800 < dias_patologia_diabetes) that when it is true, the feature dias_patologia_diabetes is above $2800$. Because this variable is true, the estimate for Case 1 is driven approx. 0.075 lower than the average predicted probability in the whole sample. Similarly, because fuma=N the estimate for Case 1 is driven approx. 0.0125 higher than the average predicted probability in the whole sample, etc. When we add all the contributions together on the average performance we get our final estimate.
  4. "Explanation fit" refers to the $R^2$ of the linear model that is fitted locally to explain the variance in the neighbourhood of the examined case. An $R^2$ of about 0.25 is generally OK to get a basic idea but I would not trust that explanation too much. Remember that using LIME we are fitting a "simple" model on top of "complex" model. We then assume that our local approximation of the simple model is faithful to the behaviour of the complex in the vicinity of the case we examine. If that approximation is bad, then our explanation is unreliable.
$\endgroup$
3
  • $\begingroup$ I am glad I could help! $\endgroup$
    – usεr11852
    Commented Jun 29, 2018 at 18:50
  • $\begingroup$ Hi @user11852 - Very useful answer, upvoted. I have a related question here. will you be able to help? stats.stackexchange.com/questions/564450/… $\endgroup$
    – The Great
    Commented Feb 15, 2022 at 14:50
  • $\begingroup$ Thank yo for the positive feedback. I will check your question. $\endgroup$
    – usεr11852
    Commented Feb 15, 2022 at 16:34

Your Answer

By clicking “Post Your Answer”, you agree to our terms of service and acknowledge you have read our privacy policy.

Not the answer you're looking for? Browse other questions tagged or ask your own question.