2
$\begingroup$

I generated completely random time-series (using MATLAB "rand" function or Python "numpy.random.rand" function) and computed the auto-correlation of these time-series using either MATLAB xcorr, or Python numpy.correlate or just the definition of correlation coefficient. Before, computing the correlation I subtracted the signal mean from it.

For a random time-series we expect to have zero correlations; however, when I generate 1000 random arrays each with 10000 samples and compute the average auto-correlation for each of them, the distribution of average correlation of trials is always biased toward negative values. I tried this with both MATLAB and Python and even for more or longer trails but the negative bias is always there (although reduces a bit by increasing the system size). enter image description here

I was wondering if anyone knows where this bias is coming from and how I can remove it?

$\endgroup$
5
  • $\begingroup$ What leads you to believe that an average correlation on the order of $10^{-5}$ or so isn't just due to sampling error? The standard deviation of the sample 1st degree autocorrelation coefficient when the true autocorrlation is zero is, for large $n$, roughly equal to $\sqrt{1/n}$, which in your case would be about 0.01. Averaging over 1000 random arrays reduces it by a factor of $\sqrt{1000}$, to about $0.0003$... so your bias seems, if anything, low in absolute value. $\endgroup$
    – jbowman
    Commented Jul 3, 2018 at 22:11
  • $\begingroup$ @jbowman Regardless, this negative bias does exist. One thing to notice is that computing sample correlation involves estimating the mean of both "variables" (the series and the lagged series). In this case, those two mean estimates are correlated, which seems to be where the bias comes from. I'm not sure that it would be particularly useful to try to correct this bias, except for very short series, however. $\endgroup$
    – Chris Haug
    Commented Jul 3, 2018 at 22:46
  • $\begingroup$ @ Chris Haug, thanks for your answer, do you know any solutions for correcting the bias in the means? How this correlation in the means would cause more negative correlations than we should have? $\endgroup$
    – Roxana
    Commented Jul 4, 2018 at 11:03
  • $\begingroup$ @jbowman thanks for your answer, it seems the bias is related to the data size and reduces as we get more data but it stays negative all the time. $\endgroup$
    – Roxana
    Commented Jul 5, 2018 at 16:37
  • $\begingroup$ @ChrisHaug - I tried recreating this in R, successfully. When I computed the correlation "by hand" rather than using a canned cor function, using the mean of the entire series instead of the two means of the sub-series as the estimate of the means, the problem disappeared, so it appears to me that you are correct. Why not write that up as an answer? $\endgroup$
    – jbowman
    Commented Jul 5, 2018 at 17:19

2 Answers 2

2
$\begingroup$

Thanks for all the answers, after searching through literature I found out, indeed there is a systematic bias in estimating the autocorrelation of time-series with a finite-size. There is a series of old statistics papers discussing this bias and even they derived its analytical form for some cases like: Marriott, F. H. C., and J. A. Pope. "Bias in the estimation of autocorrelations." Biometrika 41.3/4 (1954): 390-402 (https://www.jstor.org/stable/2332719)

It seems, there are two major sources for the bias: - mean estimation of the finite-size time-series - correlation between covariance and variance (normalization part)

If we have a long enough time-series to better estimate the mean or use the true mean that we generated the data with, the negative bias that I observed in figures above will disappear.

$\endgroup$
2
  • $\begingroup$ could you please the add the reference of the paper in case your link dies in the future? Thanks! $\endgroup$
    – Antoine
    Commented May 24, 2020 at 11:04
  • $\begingroup$ Thanks for the comment, I edited the answer and added the reference. $\endgroup$
    – Roxana
    Commented May 25, 2020 at 14:11
0
$\begingroup$

The effect of subtracting the mean...

... the same type of correlation occurs in residuals of a linear regression, which are correlated.

An image that illustrates this is in the question Why are the residuals in $\mathbb{R}^{n-p}$?

In the example below, you see an illustration for the fitting of $\mathbf{y} = a + b\mathbf{x}$ with only three points.
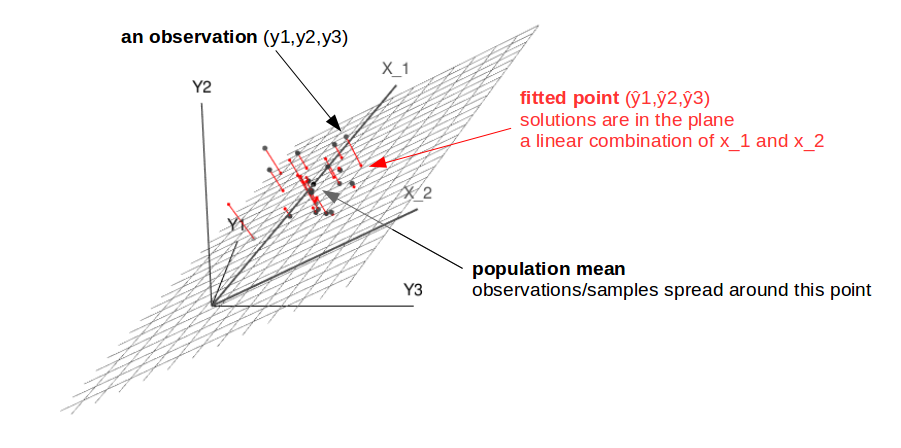
illustration for a small sample size

The error is a vector perpendicular to the surface spanned by $x_1$ and $x_2$. For any observation, the error will point in the same direction and can be seen to be a multiple of a line (a 1D space).

In the above image, no matter what the data-point is, the residual will be along a 1D vector.

In a 2-sample case the effect is the strongest and the residuals are fully correlated $$\begin{array}{rrr}x_1 - \bar{x}& = &\frac{1}{2} (x_1 - x_2) \\ x_2 - \bar{x} &= & -\frac{1}{2} (x_1 - x_2)\end{array}$$.

For multiple samples the residuals can be computed with the residual maker matrix

$$A = I - X(X^TX)^{-1}X^T = \begin{bmatrix} 1-\frac{1}{n} & -\frac{1}{n} & -\frac {1}{n}& \dots & -\frac{1}{n} \\ -\frac{1}{n} & 1-\frac{1}{n} & -\frac {1}{n}& \dots & -\frac{1}{n} \\ -\frac{1}{n} & -\frac{1}{n} & 1-\frac{1}{n} & \dots & -\frac{1}{n} \\ \vdots & \vdots & \vdots & \ddots & \vdots \\ -\frac{1}{n} & -\frac{1}{n} & 1-\frac{1}{n} & \dots & 1-\frac{1}{n} \\ \end{bmatrix}$$

For the offdiagonal elements $A_{ij} = -1/n$ and for the diagonal elements $A_{ii} = 1-1/n$.

If you start with Gaussian white noise, then the residuals will be multivariate normal distributed with covariance matrix $$\Sigma_{ij} = AA^T = \begin{cases} 1-\frac{1}{n} & \quad {\text{if $i=j$}}\\ -\frac{1}{n} & \quad {\text{if $i\neq j$}}\\ \end{cases}$$

The correlation between different terms in the time-series will be $$\rho = \frac{cov(x_i,x_j)}{\sqrt{var(x_i)var(x_j)}} = - \frac{1}{n-1}$$

For your case with $n=10000$ we would expect a correlation $\approx 10^{-4}$. I am not sure what causes the discrepancy with your results.

$\endgroup$
0

Your Answer

By clicking “Post Your Answer”, you agree to our terms of service and acknowledge you have read our privacy policy.

Not the answer you're looking for? Browse other questions tagged or ask your own question.